Hamburger
Request a demo
Close
Close
Macro Markets Insights
Make informed investment decisions with unique insights
 
Topical observations from the Qi macro lens. Build your investment roadmap with the best-in-class quantitative analysis and global data.
Pepi Stojanovski Mjsfnz8Baxw Unsplash
03.04.2024
Qi Market Spotlight: Gold is talking...What's it Saying?
Gold is pushing $2300 after Easter

There has been much commentary on the breakdown in the traditional relationships between Gold and Real Rates and the US Dollar

The significance of the Gold moves of the last couple of years is interpreted variously as a market verdict on the US debt/deficit, the credibility of the FED, US Fiscal Dominance and the general geopolitical environment driving decoupling

So what does Qi show as the key macro drivers around this…?
1. Qi confirms a significant lowering of Gold sensitivity to US$ real rates relative to the last 10yrs - particularly the “spiky” behaviour
2. Similarly, the US$ seems to have lost some of its signalling power over Gold recently

Qi shows that Gold does appear to be signalling concern in the US’s ability to run at this level of debt/deficits AND be the world’s reserve/trade cussrency AND have US$ real rates at 1.5-2%

With the traditional drivers of real yields and the dollar doing a poor job explaining Gold, the real answer may well be that real assets are a safer bet than US government debt. The diminishing sensitivity to real yields is particularly evident post Covid
Premium content, for a full analysis sign up to a month of insights
Paul Skorupskas 7Kla Xlbsxa Unsplash 099676
28.03.2024
Qi MacroVantage
#1 Commodity equities – From agriculture, to precious / base metals, to energy – all trading macro-rich
#2 US Value is no longer cheap to macro, in contrast to the beginning of March
#3 Periphery-core bond yield spreads in Europe currently dictating equity risk appetite
#4 S&P 500 Macro Beta Impulse has collapsed potentially reflecting complacency – beware when it mean-reverts
#5 Qi Model Price Momentum across regions – EEM the laggard but the divergence has scope to narrow
See more
Lucas Sankey Gdq Az6Cspo Unsplash
26.03.2024
Qi Scenario Spotlight: What if this is a Fed Error?
The debate has intensified on whether the Fed is making policy error. They are backing themselves into a corner. Is there a risk of disinflation now stalling?

Currently, there is a strong positive correlation between the dollar and inflation expectations. Warning signs would be flashing if we see this correlation sharply fall i.e. inflation expectations breaking out of their range alongside a weaker dollar.

We show the equity winners and losers from a scenario of higher inflation expectations and higher rate vol. Commodity-sensitive equities outperform – Energy, Materials, GDX. Financials, Real Estate, Technology underperform.

Qi’s signals on the three largest weights in the trade-weighted dollar suggest the risk-reward on the dollar is shifting with USD now looking expensive. The key driver is policy rate differentials => a major policy change/error would shift the low volatilty of the USD Fx crosses.

Qi's modern platform offers objective, quantified macro-on-market relationships that allow our clients to make purely evidence-based decisions.
Premium content, for a full analysis sign up to a month of insights
Paul Skorupskas 7Kla Xlbsxa Unsplash
22.03.2024
MacroVantage
#1 Risk-Reward shifting on the Dollar - EURUSD
# 2 Risk-Reward shifting on the Dollar - USDJPY
#3 Qi Model Price Momentum for SPY - since 2009, only higher coming out of GFC & Covid
#4 Equity sensitivity to Financial Conditions - more value in Russell 2000 Growth than S&P500 Growth
#5 US Financials are not the best cyclical here
#6 What is most extended in Europe? European Insurers
See more
Raychel Sanner Mnnxmvs4Cqo Unsplash
17.03.2024
Qi Market Pulse – Choppy Seas Ahead
Goldilocks is being questioned – strong employment & inflation data

Sentiment is at optimistic extremes – AAII bulls - bears

Monetary Policy Risk – both FOMC and BOJ are meeting this week, more hawkishness?

Qi flagging some defensive warnings – we have been pointing out how both VIX and SPX are moving upwards which can be a sign of volatility ahead
See more
Paul Skorupskas 7Kla Xlbsxa Unsplash
14.03.2024
Qi MacroVantage
#1 European equities - momentum waning?
#2 AUDJPY - an efficient hawkish BoJ play
#3 Qi's L/S equity tracker pricing HY credit spreads back at post-Covid tights
#4 Software > Semiconductors
#5 Long Brazil - IBOV
#6 Long Brazil - Real
See more
Todd Trapani 11Hnchukldg Unsplash Copy
06.03.2024
Qi Market Pulse - Vol Check
Qi is capturing some clues suggesting equity markets could be on the cusp of a potential regime shift. Is complacency about to give way to risk aversion?

Clue 1: Qi’s Vol Indicator has jumped 20 points higher in the last month. 2023 was a tricky year for this alternative fear gauge but, over history, it has provided an early flag for several big "risk off" moves.

Clue 2: The acceleration in S&P 500 Qi sensitivity to risk aversion rose to multi-year highs into mid-February, as VIX descended below 13. This augurs caution.

Clue 3: Subsequently the S&P500 Qi sensitivity to risk aversion turned positive at the start of March. Again, this augurs caution.
Premium content, for a full analysis sign up to a month of insights
Hannah Busing 0V6Dmtujaik Unsplash
05.03.2024
Qi Market Pulse: Value in Value?
Despite US bond yields moving higher ytd, the S&P500 is making fresh highs – The Qi sensitivity of the S&P500 to financial conditions is tentatively fading, as consensus GDP forecasts have marched higher.

The strongest major index globally is not the Nasdaq, but the Nikkei 225 with Europe’s performance almost on par with the US. In the last month, the CSI 300 has rallied almost 10%. IF this is a sign of a better global growth backdrop, will broadening market breadth come with a Value tilt?

Where does Qi find a Value tilt? Despite the S&P500 at new highs, cyclicals relative to defensives are not screening as macro-rich in this backdrop. At the sector level, Healthcare, Utilities and Staples all trades as rich to macro warranted fair value. However, Banks and Energy trade at a discount.

Value vs. Growth itself is trading at a particularly large discount: Value trades 2 standard deviations cheap to Growth within the S&P500.

At the global level, the Nikkei and Euro Stoxx 50 are now trading rich to their Qi model fair value, but model price momentum has been strong. It is Brazil’s Ibovespa which screens as the cheapest index globally today.
See more
Ferenc Horvath Skcfibu91Aa Unsplash
20.02.2024
Qi Stock Spotlight: Is the porridge too hot? Screening Inflation Sensitivities
Following the hotter than expected January CPI report and the cyclical upturn we have seen in global manufacturing (global PMI back at 50), are we reaching an inflection point in the disinflation narrative?

If we are in a market regime where there will remain a structural concern on inflation, the positive correlation between equities and bond prices will be hard to shake off.

Using Qi’s analytics, relative beneficiaries from inflation re-acceleration are dominated by Energy; relative losers are dominated by Financials and Real Estate.

Screening with Qi, the relative performance of the 20 biggest inflation winners vs. 20 biggest losers peaked in Oct-23, and have since underperformed by 27%. The former group also stands at an average Qi fair value gap of -0.7 sigma. The latter at +0.6 sigma.
See more
Pexels Miriam Espacio 110854
13.02.2024
Qi Market Spotlight: Look Up!
Be fearful when others are greedy? The S&P 500 has posted the best 3mth risk adjusted returns since the tech bubble

Through the Qi lens there are signs that crowded trades are increasingly vulnerable

The S&P 500 sensitivity to risk appetite is becoming extended - questioning whether prevailing market momentum can be sustained

The S&P 500 screens rich to US Treasuries while bond vol is also screening macro-cheap
Styles synonymous with the current Goldilocks narrative, Momentum & Growth, are trading macro-rich also. By definition, Momentum performance reflects the returns of the most popular trades. When momentum is extended, it would deem views are crowded
See more
Close
Paul Skorupskas 7Kla Xlbsxa Unsplash 099676
28.03.2024
Qi MacroVantage
#1 Commodity equities – From agriculture, to precious / base metals, to energy – all trading macro-rich
#2 US Value is no longer cheap to macro, in contrast to the beginning of March
#3 Periphery-core bond yield spreads in Europe currently dictating equity risk appetite
#4 S&P 500 Macro Beta Impulse has collapsed potentially reflecting complacency – beware when it mean-reverts
#5 Qi Model Price Momentum across regions – EEM the laggard but the divergence has scope to narrow
See more
#1 Commodity equities – From agriculture, to precious / base metals, to energy – all trading macro-rich

Consider the following:
• DBA – Invesco DB Agriculture: +2.1 Sigma FVG
• SXEP – EU Energy: +1.5 Sigma FVG
• GDX – Gold Miners: +1.5 Sigma FVG
• S5ENRS – US Energy: +1.4 Sigma FVG
• COPX – Global Copper Miners: +0.9 Sigma FVG

While DBA’s fate seems dependent on the fortunes of cocoa, energy equities have been rallying ahead of crude itself. See the first chart. Both in the US and Europe, the FVG for the Energy sector is close to 12mth highs. While Qi’s analysis from earlier this week showed real asset exposure would outperform in the event of a perceived Fed error where inflation expectations harden, at this juncture commodity equities are at profit taking levels as opposed to long entry levels.

The second chart shows the GDX FVG vs. spot price. Qi shows an inverse relationship between GDX and the dollar – and currently there is a dislocation. See the third chart.
Picture1Picture2Picture3
#2 US Value is no longer cheap to macro, in contrast to the beginning of March

At the start of March, we wrote a note “Value in Value”. We highlighted that US Banks and US Energy were among the cheapest sectors relative to the macro backdrop. Since then both of these typical value sectors have strongly outperformed. Today, they both trade macro-rich on Qi’s models.

This is perhaps best illustrated looking at RPV – the Invesco Pure Value ETF. The fair value gap is only +0.6 sigma but still large relative to recent history. See the chart below.
Picture4
#3 Periphery-core bond yield spreads in Europe currently dictating equity risk appetite

Periphery Eurozone bond spreads feature as a key driver across Qi’s equity models, globally. Given the prevalence in Qi’s models, we view this measure of Eurozone confidence as a key barometer of risk appetite. After all, European equities have outperformed the S&P500 ytd. The Sharpe of the rally of the last five months is a stand-out compared to the last few years.

With this in focus, we note that the sensitivity of European equities to this macro driver is at post Covid highs. See the first chart below. The second chart shows the z-score of the BTP-Bund spread – any loss of momentum would likely imply caution for risky assets. The sector flagbearer of Europe, EU Banks (SX7P) is already trading rich to macro at a FVG of +1.2 sigma.
Picture5Picture6
#4 S&P 500 Macro Beta Impulse has collapsed potentially reflecting complacency – beware when it mean-reverts

The macro beta impulse shows how the sensitivity of the S&P 500 to macro drivers is changing, using our short term model. Sensitivities to macro have collapsed. Indeed, the sensitivity to real yields is almost positive. Similarly, the sensitivity to risk aversion has sharply diminished. Real yields were previously such a focal point (as a drag) from late last year into February – no longer.

The below chart shows the relationship between the macro beta impulse vs. the S&P500 deviation from its 50d MA – it is negative. Our hypothesis is that Mr. Market is a neurotic patient that would prefer a backdrop of macro factor stability / low beta to macro over a backdrop of increasing macro factor volatility / high beta to macro. Now that hasn’t been the case in recent months – the macro beta has been rising BUT in favour of the index.

We are at a point now where the beta impulse sits at multi-year lows. This indicator does not trend; rather, it mean-reverts. Mean-reversion from current levels would likely coincide with a more choppy market.
Picture7
#5 Qi Model Price Momentum across regions – EEM the laggard but the divergence has scope to narrow

We have been highlighting the strong Qi model price momentum across developed market equities. See the charts below. Note that the 3mth change in the model price is close to the highs of their multi-year ranges. The outlier is EEM. Qi model price momentum has risen only 1% over the last 3mths. Further, relative to the S&P500, the divergence looks particularly wide relative to history. Under the assumption that the elastic is unlikely to stretch much further, EEM underperformance likely sees some respite from here.
Picture8Picture9
Paul Skorupskas 7Kla Xlbsxa Unsplash
22.03.2024
MacroVantage
#1 Risk-Reward shifting on the Dollar - EURUSD
# 2 Risk-Reward shifting on the Dollar - USDJPY
#3 Qi Model Price Momentum for SPY - since 2009, only higher coming out of GFC & Covid
#4 Equity sensitivity to Financial Conditions - more value in Russell 2000 Growth than S&P500 Growth
#5 US Financials are not the best cyclical here
#6 What is most extended in Europe? European Insurers
See more
# 1 Risk-Reward shifting on the Dollar - EURUSD

For some investors Fed credibility is becoming an issue. This week's FOMC revised growth and inflation forecasts higher, yet they maintained the idea of three rate cuts this year. 

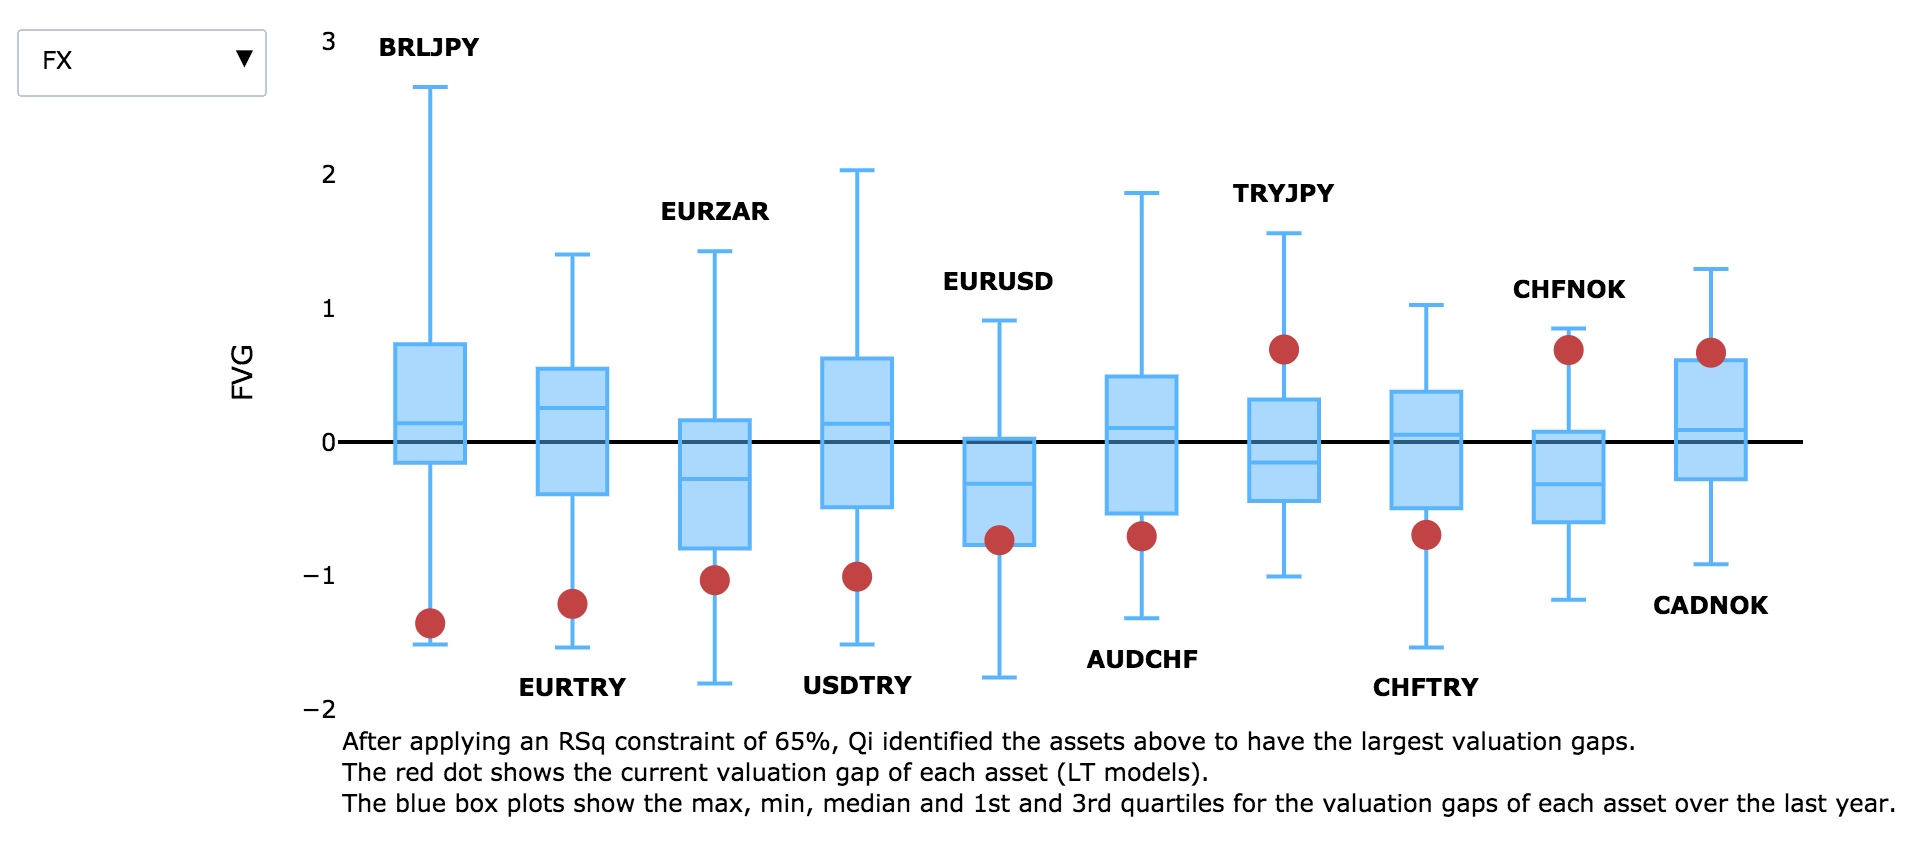
If the Fed have deliberately placed themselves behind the inflation curve, the obvious trades include shorting the Dollar, short duration, long TIP break-evens. FX looks the most interesting on Qi right now.

On Qi, EURUSD now screens as 1.1 sigma (1.5%) cheap to model courtesy of a growing divergence between macro-warranted model value and spot FX. Qi model value has risen to almost 1.10; spot EURUSD has sold off.
Eurusd
Back-testing the efficacy of a -1.1 sigma FVG as a buy signal since 2009 & when Qi's model is in regime, produces mediocre results. A 56% hit rate suggests we're just on the right side of coin toss territory, but only modestly.

But, looking at the pattern between Fair Value Gap & spot EURUSD suggests more recently our FVG has done a decent job of capturing market turning points.
Eurusd2
# 2 Risk-Reward shifting on the Dollar - USDJPY

Moreover, it is not just EURUSD. USDJPY sits 0.9 sigma (1.9%) rich to aggregate macro conditions on Qi. 

The same divergence is pattern is evident - the recent Dollar rally has not been justified by macro fundamentals. Back-tests reveal similar results. Historically using this FVG as a sell signal has produced a 58% hit rate.
Usdjpy
And the FVG versus spot chart again looks similar to EURUSD. Some false signals but more instances where Qi's Fair Value Gap has been an efficient way to signal local highs and lows.
Usdjpy2
Cable may be the most effective expression currently. It is 1 sigma (1.8%) cheap to macro. Using this FVG as a sell signal produces a 67% hit rate and a +0.56% average return.


#3 Qi Model Price Momentum for SPY - since 2009, only higher coming out of GFC & Covid

Qi’s macro-warranted model price for SPY has shown strong momentum since November.

Indeed, if we look at the 3mth change in Qi’s model price since 2009, we can see just how strong it has been – momentum has been higher only coming out of the GFC and Covid.

While cognisant of the dovish FOMC, this should point to a degree of tactical caution and the need for some consolidation. We hit similar levels in August 2023 which subsequently saw a market correction. The point is, momentum even at the Qi model value is becoming stretched.
Spy
#4 Equity sensitivity to Financial Conditions - more value in Russell 2000 Growth than S&P500 Growth

We screened for ETFs most sensitive to financial conditions. No surprise, there is a momentum / beta bias. The list includes Biotech, renewables, homebuilders, semis, regional banks, growth and small caps. 

Notably, 12 out of the list of 20 still screen as macro-cheap to Qi model value. VMFO, the Vanguard Momentum ETF, is now trading below Qi model value.

Also notable is that at both ends of the spectrum Russell 2000 Growth is trading at -0.5 sigma but S&P 500 Growth (RPG) at +0.4 sigma; i.e. there is more value looking down the cap size. The Russell 2000 itself still trades at -0.3 sigma.
Ak
#5 US Financials are not the best cyclical here

Screening US sectors reveals Financials look rich relative to several peers. XLF looks over-extended versus Industrials, Metals & Mining and Real Estate.

XLF vs. IYR looks the most interesting right now. Financials are 1.4 sigma (6.1%) rich. Both sectors want lower inflation / interest rates but XLF has discounted more good news. Even if you favour immaculate disinflation and 3 rate cuts, IYR looks the better cyclical sector if you're seeking a broadening in the rally.

Finally, we note that RETINA has just flagged a bearish signal on KBE outright.
Xlfiyr
#6 What is most extended in Europe? European Insurers.

SXIP vs. SXXP trades at +2.0 sigma rich to Qi macro model value - the 100th percentile over the last 12 months. Model price momentum is also fading.

The first chart overlays spot price to model price; the second chart Qi FVG to spot price. This again highlights the risk of mean reversion.

European insurers have been amongst the best performing sector YtD in Europe. Qi shows one of the key drivers is EuroZone confidence (peripheral bond spreads). Insurers are trading rich to this driver.
Insurers1Insurers2
Raychel Sanner Mnnxmvs4Cqo Unsplash
17.03.2024
Qi Market Pulse – Choppy Seas Ahead
Goldilocks is being questioned – strong employment & inflation data

Sentiment is at optimistic extremes – AAII bulls - bears

Monetary Policy Risk – both FOMC and BOJ are meeting this week, more hawkishness?

Qi flagging some defensive warnings – we have been pointing out how both VIX and SPX are moving upwards which can be a sign of volatility ahead
See more
  • From the point of view of Goldilocks, recent macro data has been uneven – firmness in inflation data & jobless claims, but softness in retail sales. The Citi economic surprise indices have been edging lower both in the US and Europe.
  • At the same time, sentiment gauges are at range highs e.g. see the AAII bulls less bears retail sentiment at extended levels or merely look at Dogecoin for a sense of speculative fever. From a simple price action perspective, the S&P 500 is testing the 5mth rally trend-line with an RSI exhibiting negative divergence.
Picture1Picture2
  • We enter a policy-centric week. 3mths ago the market was pricing 6 rate cuts in 2024. Are 3 cuts now looking optimistic? Couple the FOMC this week with speculation mounting on the BoJ exiting NIRP, and we potentially have reason to believe the sea will move from smooth sailing to choppy ahead.
  • This would be consistent from Qi’s perspective – in a recent note “Vol Check” we highlighted some early flags of caution (1) RSq on Qi’s short term models across major equity, bond and FX benchmarks have sharply collapsed and (2) S&P500 short term sensitivity to VIX turning positive. Triggers for our indicators were hit in early March.
Picture3
  • This likely reflects recent relationships are being tested e.g. equities higher but real yields and VIX also both higher in recent weeks. If the current macro narrative can not be explained coupled with signs of speculative activity – that is a sign of more choppy seas ahead.
  • In a report last week “MacroVantage”, we note that 4 out of our 6 observations were all defensive in nature. Namely, selling European Autos vs. Utilities (an anti-momentum risk on / off barometer?), selling AUDJPY on a hawkish BoJ, buying Software over Semiconductors, and noting that our L/S equity tracker for HY credit spreads is pricing HY credit spreads back at its tights. See our baskets tracking credit spreads and GDP growth expectations below
Picture4Picture5
  • Indeed, screening across equities most sensitive to financial conditions there is a momentum / beta bias. We list these below – which will not surprise – Biotech, renewables, homebuilders, semis, regional banks, growth, small caps would all be vulnerable areas.
Picture6
  • Tactically, Qi shows the recent enthusiasm on Copper Miners may be short term vulnerable. Qi continues to see downside in the Invesco Pure Growth S&P 500 ETF (RPG) vs. equal-weighted ETF (RSP) . In Europe, we would also highlight European insurers screening as macro rich and vulnerable to more hawkish CB rhetoric. See the charts below where we overlay FVG vs. the spot price.
Picture7Picture8Picture9
Paul Skorupskas 7Kla Xlbsxa Unsplash
14.03.2024
Qi MacroVantage
#1 European equities - momentum waning?
#2 AUDJPY - an efficient hawkish BoJ play
#3 Qi's L/S equity tracker pricing HY credit spreads back at post-Covid tights
#4 Software > Semiconductors
#5 Long Brazil - IBOV
#6 Long Brazil - Real
See more
# 1 European equities - momentum waning?

Looking under the hood of European equity markets we note that Autos are 1.8 sigma rich to Utilities. This RV pair has been a reasonable barometer of risky asset sentiment.

Auto's outperformed in the 2020/21 post Covid rally, and again over the last few months since the Fed's policy pivot. A higher SXAP / SX6P ratio moved in lockstep with rallying Euro Stoxx 600. Until the end of last month.
Picture1
If the early signs of Utilities outperforming gathers momentum, that could serve as an early warning sign for broader caution.

The chart above shows the high correlation between this RV pair's FVG and spot price relative. The table below shows the historical efficacy of using a +1.5 sigma FVG as a sell signal - an 87.5% hit rate.
Picture2
#2 AUDJPY - an efficient hawkish BoJ play

Screening Yen G10 crosses in Qi reveals AUDJPY as the biggest outlier. It's in regime (69% model confidence) and is 0.8 sigma (1.26%) rich to macro-warranted fair value.

History shows the FVG can become very (3 sigma) extended. But, that said, right now it looks the most efficient way to express Yen upside if you believe next week's BoJ produces a hawkish surprise.
Picture3
The AUDJPY fx cross is often viewed as a barometer for broader risk appetite - a high beta China play versus a safe haven asset.

How could lower AUDJPY influence equity markets? One impact could be an end to the Nikkei's spectacular run of outperformance.
Picture4
#3 Qi's L/S equity tracker pricing HY credit spreads back at post-Covid tights

Qi’s out of sample equity tracker for HY credit spreads is back at its 2021 lows.

This basket by construction has a strong defensives vs. cyclicals bias. This has aligned closely with HY credit spreads which can be seen as a good proxy for risky appetite.

With this basket pricing credit spreads at its tights, any vulnerability to the prevailing growth optimism would likely see this basket start to turn.
Picture5
#4 Software > Semiconductors

A comparatively protected RV pair trade that speaks to the anti-momentum theme.

IGV, the iShares Expanded Tech Software ETF is 1.9 sigma cheap relative to SOXX, the iShares Semiconductor ETF.
Picture6
#5 Long Brazil - IBOV

Last week's "Value in Value" insight flagged Brazil's Ibovespa as an efficient Value catch-up play.

Recent history shows a fairly tight relationship between Qi's FVG and the spot price. Conviction levels are aided by decent back test results.
Picture7Picture8
#6 Long Brazil - Real

This week we also note that Qi has USDBRL as 1.4 std dev (2.4%) rich to macro conditions.

The pattern shows more of a "drift" than a sharp divergence. However, it is notable that Qi's macro-warranted model value is threatening to make new lows. A stronger Real would be supportive to Brazilian equities.
Picture9
Hannah Busing 0V6Dmtujaik Unsplash
05.03.2024
Qi Market Pulse: Value in Value?
Despite US bond yields moving higher ytd, the S&P500 is making fresh highs – The Qi sensitivity of the S&P500 to financial conditions is tentatively fading, as consensus GDP forecasts have marched higher.

The strongest major index globally is not the Nasdaq, but the Nikkei 225 with Europe’s performance almost on par with the US. In the last month, the CSI 300 has rallied almost 10%. IF this is a sign of a better global growth backdrop, will broadening market breadth come with a Value tilt?

Where does Qi find a Value tilt? Despite the S&P500 at new highs, cyclicals relative to defensives are not screening as macro-rich in this backdrop. At the sector level, Healthcare, Utilities and Staples all trades as rich to macro warranted fair value. However, Banks and Energy trade at a discount.

Value vs. Growth itself is trading at a particularly large discount: Value trades 2 standard deviations cheap to Growth within the S&P500.

At the global level, the Nikkei and Euro Stoxx 50 are now trading rich to their Qi model fair value, but model price momentum has been strong. It is Brazil’s Ibovespa which screens as the cheapest index globally today.
See more
  • A value tilt is emerging at the global index level: Equities have benefited from a backdrop of firm growth – reflected in the fact that as bond yields have moved higher so has the S&P500 ytd. This is true even if we exclude the Mag 7. It is notable that particularly over the last month, global growth optimism has risen. The best global indices over the last month in order are the CSI 300, Nikkei, Euro Stoxx 50, Nasdaq and then S&P500. Below we show the 4wk % change in the Qi model price across the major DM indices – the point is that this is not being led by the Nasdaq.
Picture1
  • S&P500 sensitivity to financial conditions is fading: From Qi’s perspective, model price momentum for the index has remained strong. Secondly, the sensitivity of the S&P500 to financial conditions is tentatively fading, as economic data surprises and consensus GDP forecasts have marched higher. Below, we show the 4wk change in S&P500 financial condition sensitivity i.e. the beta impulse, rolling over during the last month.
Picture2
  • Despite the overall market at highs, there is more value in select cyclicals than defensives: Among the more expensive sectors in the S&P500, relative to their Qi macro-warranted model, are Staples, Utilities and Healthcare. Staples and Utilities have also seen their Qi model value move lower over the last month. See the quadrant chart below where we compare the Qi FVG across the US sectors to model price momentum over the last month.
Picture4
  • Staples, Utilities, Healthcare screen macro-rich, but Energy and Banks screen macro-cheap: Under the hood, Qi is saying that defensive sectors are expensive but there is emerging value in the value-orientated sectors of Energy and Banks. Within Energy, we show the FVG vs. spot price of OIH (Oil Services) below, trading at -1 sigma. Regional banks have been treading water of late relative to the broader market. We have persistently highlighted the regional banks as the MOST SENSITIVE to inflation expectations. Perhaps better to wait for the next CPI release, but if we get calmer prints it is perhaps THE biggest beneficiary
Picture5
  • The Value style itself is trading at a particularly large discount to growth: Perhaps this is not surprising given the excitement and expected earnings growth from AI beneficiaries / tech. However, the Invesco S&P500 Pure Value ETF is trading at -2.1. sigma relative to the Invesco Pure Growth ETF. This discount is particularly large relative to recent history. The point is this, if you believe in better global cyclical news, more breadth beyond the mega-cap techs will more likely be seen in the value space.
Picture6
  • At the global level, where is there value? Brazil: The IBOV screens as 1-sigma cheap to Qi macro-warranted value. While, EWZ vs. EEM screens at -1.4 sigma. Major drivers of the IBOV are higher commodity prices, higher inflation expectations, a stronger dollar and strength in global GDP. Both outright and RV vs. EEM look like interesting entry levels given the relationship between Qi fair value gap and the spot price in recent years.
Picture7
Ferenc Horvath Skcfibu91Aa Unsplash
20.02.2024
Qi Stock Spotlight: Is the porridge too hot? Screening Inflation Sensitivities
Following the hotter than expected January CPI report and the cyclical upturn we have seen in global manufacturing (global PMI back at 50), are we reaching an inflection point in the disinflation narrative?

If we are in a market regime where there will remain a structural concern on inflation, the positive correlation between equities and bond prices will be hard to shake off.

Using Qi’s analytics, relative beneficiaries from inflation re-acceleration are dominated by Energy; relative losers are dominated by Financials and Real Estate.

Screening with Qi, the relative performance of the 20 biggest inflation winners vs. 20 biggest losers peaked in Oct-23, and have since underperformed by 27%. The former group also stands at an average Qi fair value gap of -0.7 sigma. The latter at +0.6 sigma.
See more
  • Recent data has raised concerns on whether the battle against inflation has truly been won : It is now the second straight month that core and headline CPI has come in hotter than expected. January core services less shelter inflation saw the biggest MoM jump since September 2022; ISM Services Prices Paid has jumped to 64; and the NFIB small business survey on compensation plans remains elevated. When the global manufacturing PMI is back at 50, alongside easing financial conditions, together these portend the possibility that inflation may be finding a base.
  • Today, the average S&P500 stock has a negative sensitivity to long term inflation expectations – no surprise, given that the disinflation narrative and financial conditions have been at the heart of the “everything rally" over the last 4mths. Below, we show the SPY Qi sensitivity to US inflation expectations (% change for a 1 standard deviation move higher in the macro driver) – still firmly negative.
Picture1
  • The positive correlation between equities and bonds will be a hard one to shake off . While we have NVDA earnings ahead of us and there is medium term excitement on the productivity gains AI could bring, today Qi suggests we are still in a market regime where there is a structural concern on inflation.
  • Qi shows the biggest winners from higher inflation are dominated by Energy; the biggest losers Real Estate, Financials, Utilities. See the first chart below where we compare the sensitivity to inflation expectations to the Qi fair value gap (sigma deviation between spot and model price) for the GICs Level 1 sectors. Aside from noting the relative winners from inflation, we also note that today most sectors are trading macro-rich. The second chart show the Qi FVG for the RV pair XLE vs. XLF, overlaid with the spot price. The XLE / XLF pair is not yet especially cheap but one to keep on the radar. Bear in mind, across the major sectors it is Financials which have seen the largest PE expansion from the October market lows i.e. they have been one of the biggest beneficiaries from the disinflation narrative.
Picture2Picture3
  • Extending this to the stock level, the relative performance of the 20 biggest inflation winners vs. 20 biggest losers has been stabilizing over the last month, after a steep correction: We showcase the Qi screen below – identifying those S&P 500 stocks with the largest positive and negative sensitivities to inflation, respectively. 
  • The chart shows the equal-weighted performance of those names. The winners have underperformed the losers by 27% from their peak. What makes all this more interesting is that inflation winners are 0.6 standard deviations cheap to Qi’s macro model while losers are 0.7 standard deviations expensive. There is an expected edge on both sides if inflation keeps nudging higher.
Picture4Picture5Picture6
Pexels Miriam Espacio 110854
13.02.2024
Qi Market Spotlight: Look Up!
Be fearful when others are greedy? The S&P 500 has posted the best 3mth risk adjusted returns since the tech bubble

Through the Qi lens there are signs that crowded trades are increasingly vulnerable

The S&P 500 sensitivity to risk appetite is becoming extended - questioning whether prevailing market momentum can be sustained

The S&P 500 screens rich to US Treasuries while bond vol is also screening macro-cheap
Styles synonymous with the current Goldilocks narrative, Momentum & Growth, are trading macro-rich also. By definition, Momentum performance reflects the returns of the most popular trades. When momentum is extended, it would deem views are crowded
See more
1/ The sensitivity to risk appetite macro drivers has accelerated sharply - what can go wrong?

Qi identifies an asset’s sensitivities to a large macro driver information set. Broadly, these macro drivers can be bucketed into financial conditions (e.g. credit spreads, real rates, USD TWI), growth expectations (e.g. GDP Nowcast, metals, energy) and risk appetite (e.g. VIX, gold / silver ratio).

Below, we show the 4wk change in those bucket sensitivities for the S&P 500 – we refer to these 4wk changes as the market’s macro beta impulse to these specific drivers. This highlights the focus on financial conditions but what has caught our eye this week is the increasing attention to risk appetite.
Picture1
The sensitivity to risk appetite has accelerated as VIX has descended below 13. Reliance on low equity volatility rises as the market accelerates. However, as this reaches close to multi-year highs, the premise presumably is that everyone is close to “all in” on the prevailing narrative.

The charts below plots the sensitivity to risk appetite vs. the S&P 500 and to VIX itself (sensitivity inverted on rhs axis). The simple point is that when sensitivity to risk appetite is becoming extended, it questions whether prevailing market momentum can be sustained. Perhaps no surprise, after the best 3mth risk adjusted return since the tech bubble.
Picture2Picture3
2/ Equities screening rich to bonds & bond vol screening cheap

Below we show Qi’s model value vs. spot for the SPY ETF relative to the GOVT ETF (iShares US Treasury Bond ETF). The second chart shows the current dislocation in terms of the fair value gap vs. the spot price (+1.2 sigma).

Of late, commentators have noted that the correlations between equities and bond prices have started to wane i.e. growth is deemed strong so the level of rates matters less. However, Qi has picked up on that dislocation, arguing in the short term, the move looks over-extended.
Picture4Picture5
In contrast, treasury bond vol as proxied by VXTLT is screening below its Qi macro-warranted value (-0.8 sigma):
Picture6
3/ Styles synonymous with the current Goldilocks narrative, Momentum & Growth, macro rich also

First, consider the VFMO Vanguard US Momentum Factor ETF. The biggest macro driver for Momentum has been financial conditions – a weaker dollar, lower real rates, tighter credit spreads. Below see Qi’s macro model value vs. spot and secondly against the GS Financial conditions index. The third shows the same dislocation but in FVG terms.
Picture7Picture8Picture9
Secondly, consider similar charts for growth (RPG Invesco Pure US Growth ETF) or long duration plays like Biotech (IBB iShares BioTech). Similar drivers, but the over-extension is concerning.

By definition, Momentum performance reflects the returns of the most popular trades. When momentum is extended, it would deem views are crowded.
Picture10Picture11
Close
Thank you for request
A team member will contact you soon shortly.
Find out more
Explore Quant Insight's unique data, analysis and solutions to understand how you and your team can easily integrate our information into your workflow.
Book a 15 minute intro call here


Or, simply complete the short enquiry form on this page, and one of our team will be in touch via email.
Name: 
Company email: 
Tel number (optional): 
Company: 
My geographical location is:

My asset class focus is:
Submit