Hamburger
Request a demo
Close
Close
Macro Markets Insights
Make informed investment decisions with unique insights
 
Topical observations from the Qi macro lens. Build your investment roadmap with the best-in-class quantitative analysis and global data.
Max Larochelle Uu Jw5Sunyi Unsplash
06.04.2022
Don't fight the Fed
When Governor Brainard, typically seen as a dove, starts a speech by quoting Volcker, & then goes on to say the Fed will reduce the balance sheet at “a rapid pace” starting next month, markets should probably take the hint.
Premium content, for a full analysis sign up to a month of insights
Felix Mittermeier L4 16Dmz 1C Unsplash
05.04.2022
Leads & Lags
The US yield curve tends to capture all the attention as a recession indicator, but it does not have a monopoly as a predictive tool. There are several proxies for forward growth across asset classes.
Premium content, for a full analysis sign up to a month of insights
Pexels Miriam Espacio 110854
04.04.2022
Are we asking
the wrong question?
The inversion of the 2s10s US yield curve after Friday’s Payrolls report has already generated a huge weight of commentary. Here we focus not on the yield curve itself, but its implications. In this instance looking at US equity sectors plus some thematic ETF plays.
See more
Omega Nebula 11053 1920
01.04.2022
Watch US High Yield credit
US High Yield ETFs suffered $3.2bn of withdrawals last week according to MarketWatch data. The bulk of the outflows were from HYG, the iShares iBoxx US High Yield credit ETF.
Premium content, for a full analysis sign up to a month of insights
31.03.2022
Choose Canada
Canada, as a resource rich country, has emerged as a clear winner from Russia’s isolation. Even with March’s rally, most global equity markets are still down year-to-date. The S&P/TSX is up 4.0%.
Premium content, for a full analysis sign up to a month of insights
Pexels Sam Willis 3934512
30.03.2022
A protected European long
RETINA™ has a high conviction signal on European Consumer Discretionary versus the Euro Stoxx 600.
See more
David Edelstein N4Dbvtudikw Unsplash
29.03.2022
Japanese exceptionalism
Most Yen crosses fell out of regime a few months back. Model confidence on USDJPY for example is just 10%. Previous macro patterns are not doing a good job of explaining current price action.
Premium content, for a full analysis sign up to a month of insights
Adam Birkett 77Hmm5Tg N4 Unsplash
24.03.2022
Not all ESG is created equal
Several ESG plays have suffered of late. The realpolitik of the current energy crisis has prompted some to re-think their exposure to the environmental aspect of ESG.
Premium content, for a full analysis sign up to a month of insights
Evgeni Tcherkasski Bfbhwj4Qafo Unsplash
23.03.2022
The return of TINA?
There’s a lot of head scratching in mainstream media on why equities rallied again yesterday, even after Powell doubled down on his hawkish rhetoric.
See more
Jake Weirick 09Bqxnvo7Eu Unsplash
22.03.2022
Decoupling
US vs. European sectors
Two charts, two very different pictures.

US & European sectors are in very different macro regimes currently.
Premium content, for a full analysis sign up to a month of insights
Close
Pexels Miriam Espacio 110854
04.04.2022
Are we asking
the wrong question?
The inversion of the 2s10s US yield curve after Friday’s Payrolls report has already generated a huge weight of commentary. Here we focus not on the yield curve itself, but its implications. In this instance looking at US equity sectors plus some thematic ETF plays.
See more
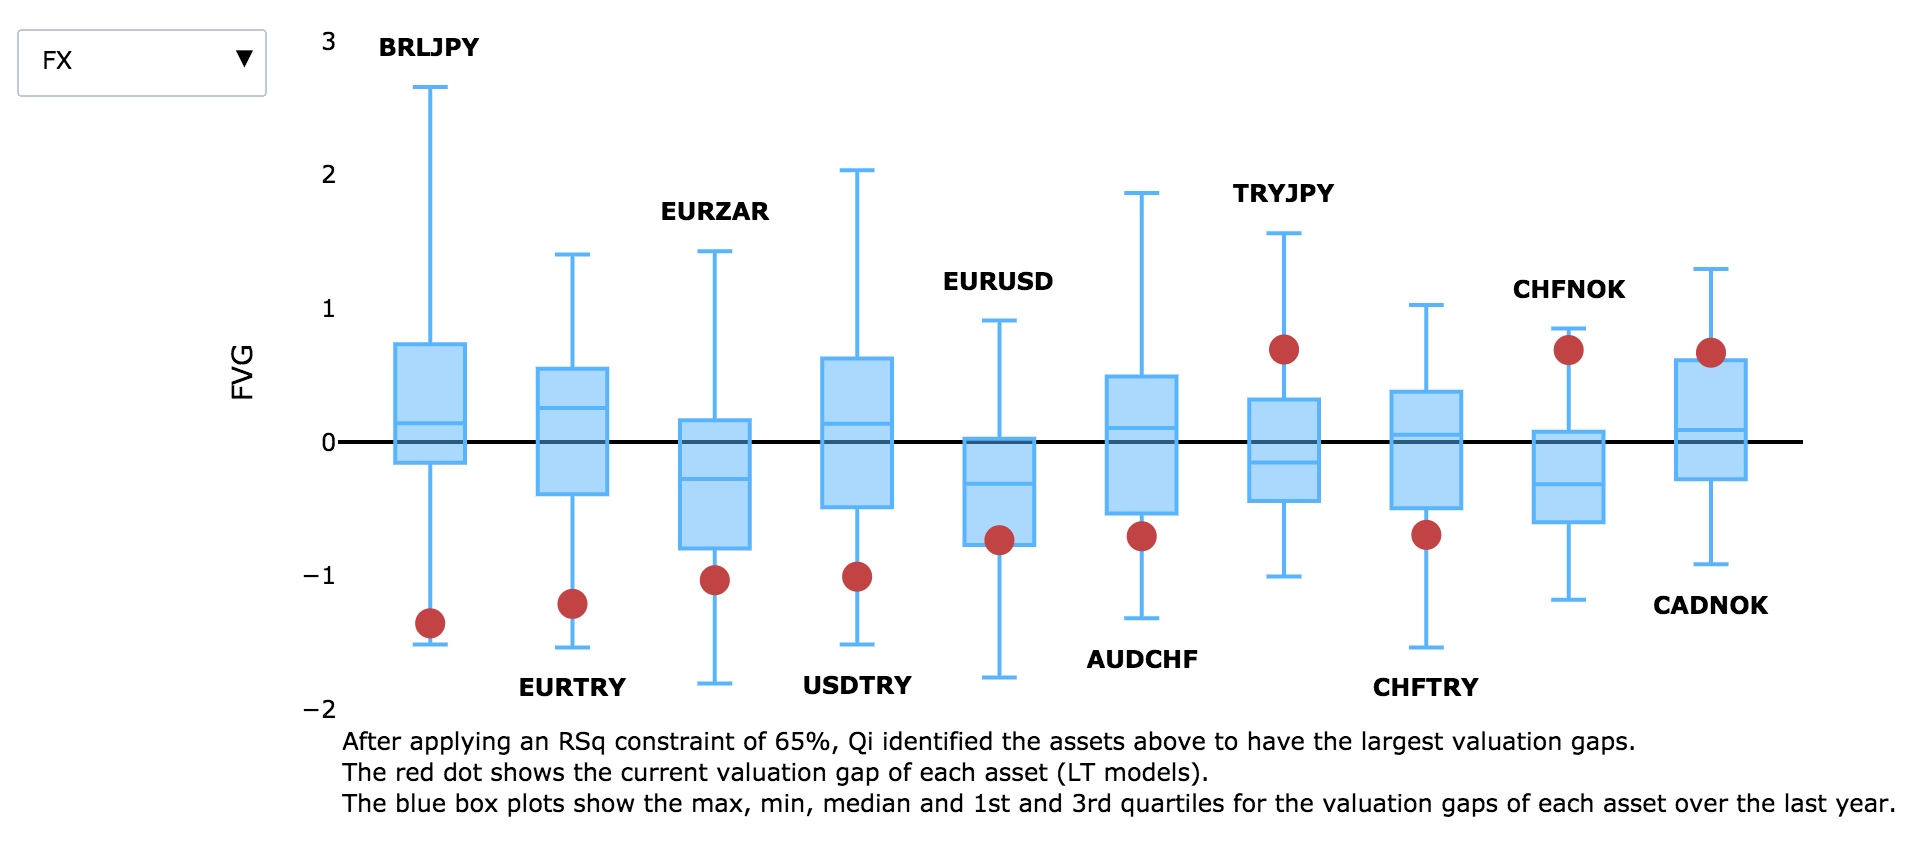
Only sectors / ETFs in regime (confidence > 65%) are shown. Models to the right of the zero vertical bound want a steeper yield curve; those to the left are comfortable with curve flattening.

The four most reliant on a steep yield curve (therefore most vulnerable to curve inversion) are all speculative technology names. Online Retail IBUY, ARG Genomic Revolution ARKG, e-commerce EBIZ & Social Media SOCL. ARKG also has the misfortune to post a slightly rich valuation versus macro fair value.
Screenshot 2022 04 04 At 100255
There is often a blanket assumption that technology wants lower long rates. While it is true lower discount rates help companies whose profits are typically further in the future, the current pattern appears to stress the growth part of the equation. A recession hurts profitability, & those with profits furthest away most of all.

It is also noticeable how all the traditional GICS Level 1 sectors in regime hover around the zero bound. Most had a positive relationship to the curve but sensitivity has slipped. This is true for both cyclicals (Energy, XLE) & defensives (Health Care, XLV). Is there a broader regime shift under way?

Possibly but it must be emphasised the chart above screens solely for sensitivity to the yield curve &, despite all the hype, it is not the dominant macro driver currently. All the speculative tech names want low risk aversion, tight credit, global growth & a weak Dollar more than they care about curve shape. XLE & XLV’s drivers differ but the yield curve doesn’t feature in the top 10 of either.

Mainstream research focuses on the yield curve as a predictor of recessions & asks whether there are valid technical reasons why it's different this time. The picture from Qi seems to be asking, on current patterns, do equity markets even care about the yield curve?
Pexels Sam Willis 3934512
30.03.2022
A protected European long
RETINA™ has a high conviction signal on European Consumer Discretionary versus the Euro Stoxx 600.
See more
State Street’s tracking ETF for the MSCI European Consumer Discretionary sector STR is now 1.4 sigma (6.3%) cheap relative to the broader Euro Stoxx 600 (using tracking ETF MEUD).

Moreover, we now have a bullish inflection signal – after a period of divergence, over the last 3 days model & spot price have both turned higher.

The combination of historical back-tests, model value gradient & the trend / momentum picture all conspire to make this a 4-bar idea - the highest conviction signal on RETINA™.

Focusing just on back-tests, the STR / MEUD ratio has only been this cheap & in regime nine times since 2009. The hit rate on that as a buy-the-dip signal is 88.9% for an average return of +1.2%.
Str Vs Meud
The drivers are highly intuitive. To outperform, Consumer Discretionary needs a Goldilocks environment – stronger global growth (Now-Casting tracking GDP plus higher commodities), healthy risk appetite (low VIX etc), easy financial conditions (especially tight credit spreads).

Such a position will only appeal to investors with a certain macro view - to those who have faith in the economic cycle &, by extension, probably believe (hope) the worst of the war in Ukraine is behind us.

But, as a relative value play that contains long one sector versus a short in the broader Stoxx 600, it does at least offer a comparatively protected upside trade expression.
Evgeni Tcherkasski Bfbhwj4Qafo Unsplash
23.03.2022
The return of TINA?
There’s a lot of head scratching in mainstream media on why equities rallied again yesterday, even after Powell doubled down on his hawkish rhetoric.
See more
The glib response would be Qi shows US equities in strong macro regimes, narrowing their valuation gaps relative to last week’s oversold levels, but still catching up with rising model value. Check out the Historical Model Value chart for SPY or re-read “Catch up”.

Another explanation doing the rounds is the relative value facing asset allocators when deciding between stocks & bonds. Bonds are selling off because of inflation, & equities are a better inflation hedge goes the narrative. The ‘There Is No Alternative’ mantra is back.

Qi’s SPY vs. GOVT model is on the cusp of a new macro regime. Having traded sideways for much of 2022, the macro model value now points to a new uptrend – S&P500 to outperform US Treasuries. Having been cheap to bonds, stocks have played catch up.
Spy Vs Govt
The new regime is dominated by rising inflation, Fed rate hikes, low risk aversion & tight credit spreads - together they explain two thirds of the model & point to equities outperforming bonds.

On current patterns, equities are enjoying a relative sweet spot. If the Fed can pull off the balance between tightening policy without prompting “risk off”, equities can continue to ‘climb the wall of worry’.

But bears worry that rising equities undermine Fed efforts to tighten overall financial conditions. Under this scenario rising equities sow the seeds of their own downfall by provoking a more hawkish Fed.

On Qi, watch the Fed rate expectations & inflation expectations factors. If those relationships flip from positive to negative, that downside scenario is panning out.

Also watch Qi’s Fair Value Gap. Currently just +0.4 sigma (+1.5%) but it’s a tight distribution: +0.8 sigma is the FVG high for the last year.
Close
Thank you for request
A team member will contact you soon shortly.
Find out more
Explore Quant Insight's unique data, analysis and solutions to understand how you and your team can easily integrate our information into your workflow.
Book a 15 minute intro call here


Or, simply complete the short enquiry form on this page, and one of our team will be in touch via email.
Name: 
Company email: 
Tel number (optional): 
Company: 
My geographical location is:

My asset class focus is:
Submit