08.09.2021
A Macro Roadmap
Qi founder & CEO Mahmood Noorani takes a step back to look at the bigger picture. And how Qi can help navigate the major macro risks between now and year-end.
Where are we now? “Max Policy”
- We are at a maximal monetary and fiscal policy stimulus.
- We have supply side bottlenecks from Covid, and “globalisation” has reversed somewhat.
- The result of both the above was very strong GDP growth and Inflation.
- Fiscal has also resulted in a large increase in government debt. But, with yields at these levels, governments have decided it is worth spending aggressively. They haven’t just smoothed out the Covid recession, they have converted it into a boom!
- There is also a very large amount of corporate debt in the system
What are the risks? And how can Qi help?
1.) Monetary Policy Shift
Clearly, if the Fed shifts to a tightening bias, markets won’t like this, especially if the speed of response is fast rather than gentle.
Why would they tighten aggressively? Seems the only reason they would do this is if they felt long term inflation expectations were becoming “unanchored”. How would Qi pick this up?
If we see major US equity indices become negatively sensitive to long term (10y) inflation expectations, then that would be a sign that the market is worrying about a fast Fed tightening driven by higher Long Term inflation expectations. As another confirming factor, one would expect higher negative sensitivity to 10y inflation expectations compared to short term 2yr expectations.
If 10y nominal and real yields rise as a result of tightening, then we would see stocks showing significant negative sensitivity to higher rates.
We may also see stocks showing rising sensitivity to the US 5s30s yield curve.
S&P500 sensitivity to the US Yield Curve
* The chart shows the percentage impact on SPX for a one standard deviation increase (steepening ) in the US 5s30s yield curve, every other factor held constant.
* For most of 2020, the S&P500 wanted a flatter yield curve – suggesting reliance on QE & the Fed keeping rates low.
* That started to change after the November election result and, after the Georgia result in January, the relationship turned positive; i.e. a steeper yield curve was consistent with higher SPX. US large caps liked the reflation narrative.
* That shift proved short-lived & the relationship is modest currently but an increase in sensitivity could speak to another regime shift & a change in market perception around the Fed’s reaction function and its impact on future growth.
2.) Fiscal Policy Shift
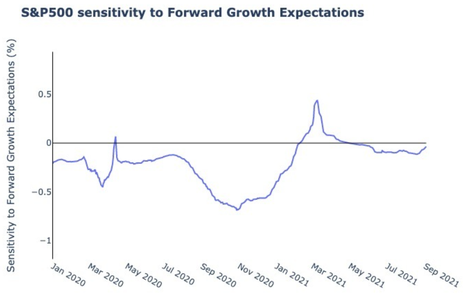
If the US signals an end or a reverse to fiscal expansion, this would probably see long term growth expectations decline; i.e. US 5s30s curve flattening.
If Qi shows rising sensitivity of stocks to the curve, then this could be a warning that peak fiscal has occurred and markets are worrying about payback.
3.) Credit Cycle Shift & Defaults
If the amount of corporate debt is in fact an issue, and rising defaults and rising rates are causing corporate pain, we will see an increase in sensitivity to HY credit spreads.
The chart shows the percentage impact for a one standard deviation increase (widening) in corporate credit spreads. The relationship is inherently negative – equities want tighter credit spreads.
Note the first leg lower in March 2020. This was the Fed’s initial policy response to lockdowns which included expanded QE – both in size, but also in scope, i.e. “fallen angels”.
SPX’s reliance on tighter credit spreads increased through the rest of 2020 – it was the dominant driver meaning while the Fed back-stopped credit spreads, dips in the S&P500 were buying opportunities. That changed after the Democrat win & the emergence of a fiscal response reduced sensitivity to credit.
If sensitivity picks up once again, that will reflect one of two things. Another round of QE that further widens Fed asset purchases in credit. Or, the market is starting to fret about the health of the credit cycle.

4.) Max Policy Persists and Creates a Big Inflation Problem
Maybe policy makers just let the economy run too hot, for too long. What could go wrong?
The Dollar is undermined – look for a more serious weakening of the USD if real rates keep going negative. We would see very high negative sensitivity of the Dollar to inflation expectation differentials. See EURUSD case study below.
Big US bond sell off. If the Fed loses credibility, maybe foreign investors start selling US bonds in such size that QE is overwhelmed. The reserve status of USD has protected US Treasuries but it’s possible that this breaks. US long bonds would have very high sensitivity to 10y US inflation expectations; sensitivity to GDP growth would not be high as it wouldn’t really matter too much. The Qi portal showcases that sensitivity on a daily basis.

EURUSD – 2020 case study
* EURUSD was out of regime over the first half of 2020 – the cross simply wasn’t sensitive to macro factors.
* In June a new regime emerged; one where sensitivity to inflation differentials was key. At the time Fed QE had pushed 10y real yields to -50bp but easy monetary policies meant they were just starting a journey to -100bp.
* A range-bound EURUSD had frustrated Dollar bears over H1’20. But the Qi signal gave anyone believing Fed largesse equated to a weaker USD, the green light to increase risk. Spot EURUSD rallied from 1.12 at the start of June to 1.19 over the next 2 months.