23.05.2024
Qi MacroVantage
1. A fragile equilibrium for risky assets?
2. AI Party in the most boring sector – Utilities – very rarely has the sector been richer on Qi
3. Trump not seen as a risk for stocks – indeed, the Qi sensitivity to a Trump Win is positive
4. Re-rating FX
5. United Health Group (UNH) – looks rich to macro valuation after positive earnings
2. AI Party in the most boring sector – Utilities – very rarely has the sector been richer on Qi
3. Trump not seen as a risk for stocks – indeed, the Qi sensitivity to a Trump Win is positive
4. Re-rating FX
5. United Health Group (UNH) – looks rich to macro valuation after positive earnings
1. A fragile equilibrium for risky assets?
Falling Risk Aversion and tighter HY credit spreads have been at the epicentre of higher Qi model values for risky assets over the last month. This rally has not been about economic growth expectations - see the first chart showing the 1mth drivers of SPY model value. Further, Risk Aversion and HY credit spreads are the largest SPY macro exposures.
3 Qi observations to show why this is a fragile equilibrium:
1. The ST model Qi FVG for the ETF UVXY (ProShares Ultra VIX Future) i.e. Risk Aversion itself is almost 1 sigma cheap, which is at the bottom of its 12mth range. Nov'23 was a poor signal for vol as Rsq fell sharply in the aftermath of the Fed Pivot and QRA announcement. This time around ST model RSq has been rising.
2. The ST model Qi FVG for CDX HY credit spreads is also at the bottom of its 12mth range. Qi shows the biggest widening driver of credit spreads are higher vol, higher real yields, a stronger dollar and higher rate vol. Below see the FVG vs. spot price of CDX HY spreads - again the same point that there is not much risk premia to harvest.
3. Tech has been the sector leader of the rally over the last month. Qi shows the QQQ as cheap to model value in mid-April BUT today it is rich at the upper end of its historical range. The burden is high on NVDA.


2. AI Party in the most boring sector – Utilities – very rarely has the sector been richer on Qi
US Utilities have been among the best performing sectors over the last month, last 3mths and YTD! The sector’s relationship with bond yields has completely broken down. The first chart below shows the sector’s Qi sensitivity to US 10yr real yields – the most positive it has been since 2009. The second chart shows Qi’s FVG – we hit the second highest FVG since we have data from 2009.
The narrative shift on electricity producers is based on AI data centre power demand. Some discernment is necessary though on the sector which is showing signs of exuberance. As consumer facing businesses, many utilities typically received regulated returns on regulated assets (outside of independent power producers). Many also are faced with ageing assets just as the cost of capital is rising.
Are Utilities really AI stocks?


3. Trump not seen as a risk for stocks – indeed, the Qi sensitivity to a Trump Win is positive
Qi’s macro factor models are customisable. With this in mind, we created 2 variations of our Qi model for SPY. The first including the daily time series of Real Clear Politics betting odds for a Trump win. The second for a Biden Win.
The first takeaway is that rising Trump odds is seen as a positive for risky assets. Empirically, see below simply overlaying Trump betting odds vs. the S&P 500 index. Secondly, that sensitivity has been rising since February. Over the second half of 2023, rising Trump winning odds was seen predominantly as a negative driver and it switched early this year. See the second chart. An SPY model including Biden Betting odds, reveal it as not a driver at all currently for stocks. See the third chart. Also of note is that we included Trump odds in a Qi model for EURUSD - a Trump Win is seen as USD negative.
Arguably, this reflects the market’s belief on Trump pursuing again expansionary policies and being pro tax cuts (despite the size of the fiscal deficit and follow-on risk to inflation). After all, we have already seen Trump take credit for 2023 market gains, saying “This is the Trump Stock Market…investors are projecting that I will win, and that I will drive the market up.”


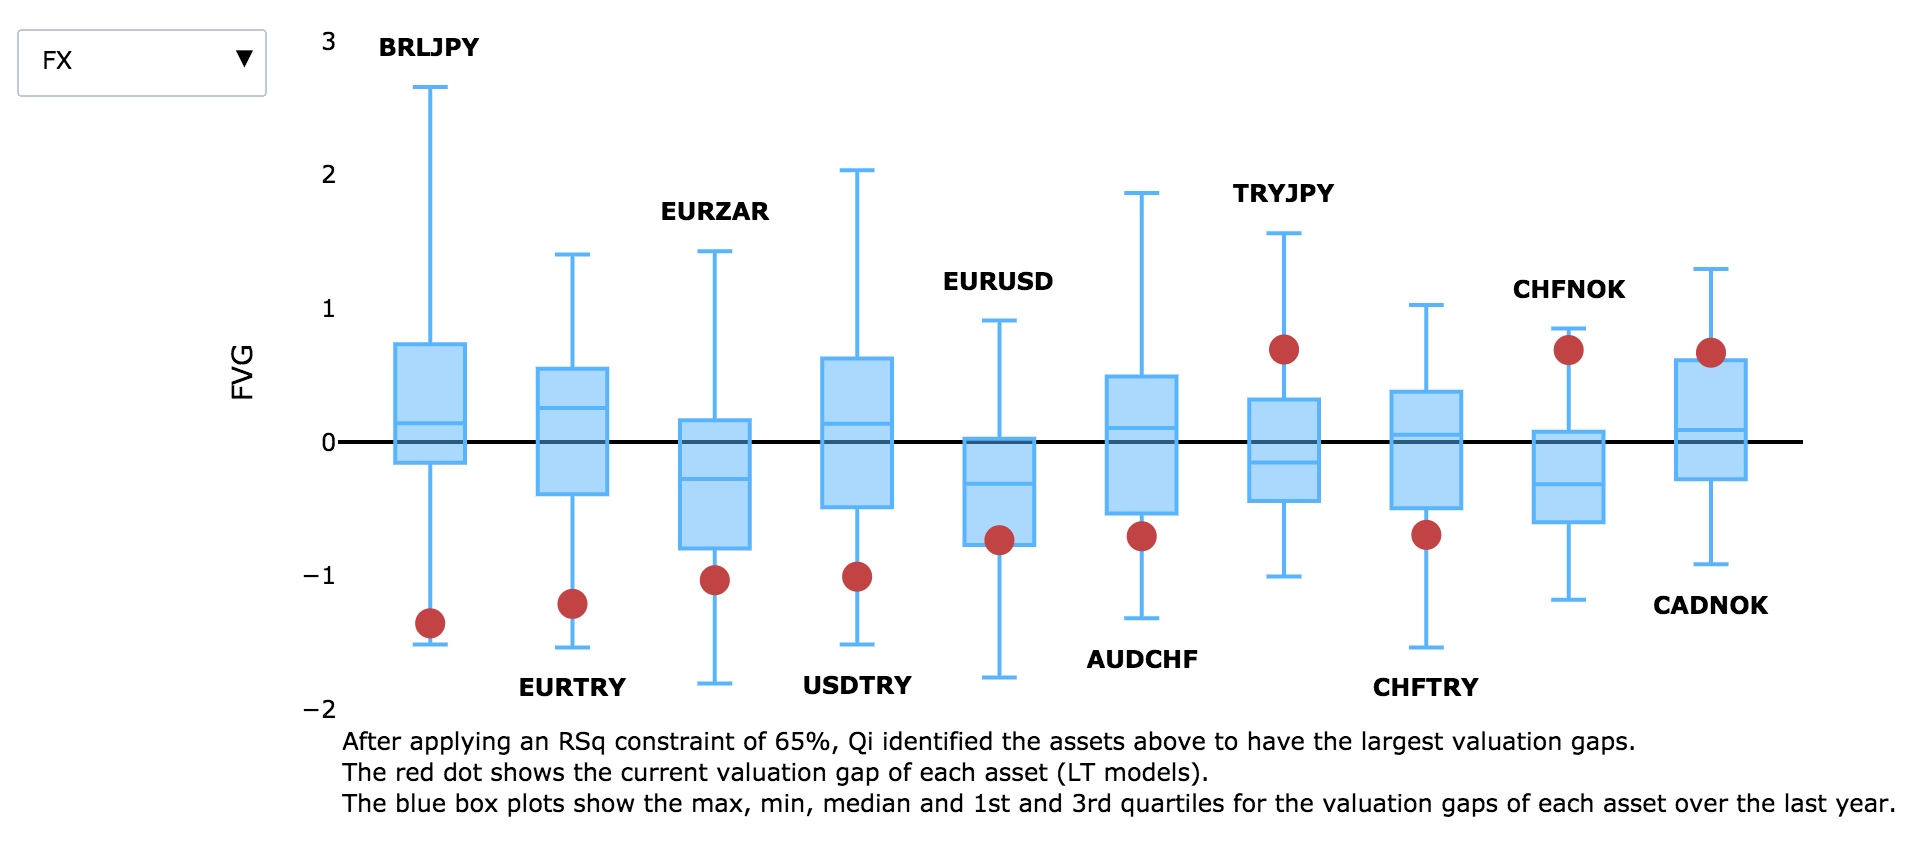
4. Re-rating FX
Qi flagged bullish signals on EURAUD & GBPAUD at the end of April. In both instances, model value was flat-lining while Aussie strength saw the crosses sell-off further than aggregate macro conditions warranted.
Yesterday’s sticky core & services CPI print in the UK was the catalyst for a catch-up. From 2% cheap to model a few weeks ago, GBPAUD is now ‘just’ 0.5% cheap.

The mileage for a further correction sits in EURAUD at these levels. It still sits 1.4% cheap to the broad macro environment.

In terms of new signals, note USDCHF now screens as 1.2 sigma (2.6%) rich to macro conditions.
The cross can be thought of as a battle between two safe haven currencies. And, on current patterns, higher risk aversion benefits the Dollar over the Swiss Franc.
And it is because VIX is sub 12 that Qi model value has declined and spot has ignored that move lower. Hence the Fair Value Gap.
Historically, there have been 29 instances when USDCHF has been in regime (RSq > 65%) & this rich in FVG terms. So crudely we get this signal twice a year.
And the signal has a 66% hit rate & posts an average return of +0.77%.

5. United Health Group (UNH) – looks rich to macro valuation after positive earnings
• UNH has moved up strongly after modestly positive earnings
• However, the macro valuation has declined consistently over the last 10 weeks from $525 to $462
• This makes UNH 9.4% rich or 2sigma rich to Qi fair value (chart below). This FVG has done an effective job of catching local highs & lows.
• UNH is sensitive to stronger GDP and steeper curve but wants lower inflation; it is also defensive in the face of volatility and QT
• The share price is still trending strongly upwards but is now dangerously ahead of the fair value.