Be Careful What You Wish For:
Fed Rate Cuts a Drag for Cyclicals

1. Small Cap rotation is hostageto inflation
2. Rate Volatility - the BlindSpot in Equity Risk
3. Rising Rate Vol - the AchillesHeel of IBB
Key Takeaways:
The market is trying to force the Fed’s hand: Markets have shifted from expecting 1 rate cut over the next 12mths in January to now pricing in 3, signalling pessimism on growth.
Rising Fed rate cuts a key macro factor drag through this pullback: Qi’s Risk Model highlights that shifting Fed rate expectations have been a key driver of market underperformance, particularly for cyclical sectors like Technology and Consumer Discretionary.
So where to from here? If you believe the front end of the curve is well-priced, cyclicals can steady BUT the model suggests still fade the rallies: Powell this week will need to reassure. Qi’s Risk Forecast for the S&P500 is on the rise (+1.3 SD above 50d mean, implying rising fear); however, a strong rebound requires a deeper dislocation.
Context:
FOMC this week – Fed in a difficult position: While the outlook is becoming more murky on business investment, jobs growth and consumer spending, the Fed has little choice but to sit on its hands and hope the tariff clouds clear. On the other side of the Fed mandate, core PCE has been above 3% for almost 4 years.
Market pricing 3 Fed rate cuts over the next year vs. only 1 back in mid-Jan: Reflecting the pessimism on the growth outlook. Many now believe it is no longer if the labour market will sour, but when.
Why does this matter?
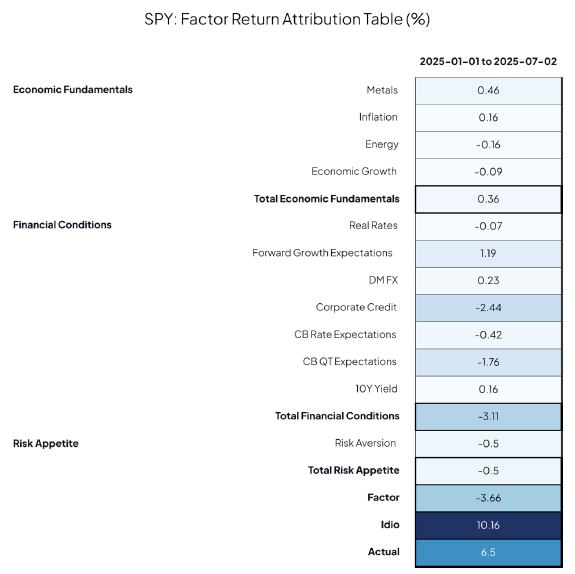
Qi’s Risk Model shows Fed rate expectations have been a major market drag: Qi’s Risk Model is comprised of 12 macro factors of which Fed rate expectations is one. This is defined as the difference between the 1y1y forward yield and the spot 1y yield. This effectively captures what money markets are discounting in terms of policy rates in the next 12 months, i.e. whether the Fed is hiking or cutting rates & at what speed. The chart below shows this factor vs. the performance of cyclical vs. defensives in recent months.

Through this pullback, macro has been OFFSIDE across cyclical sectors – notably Technology and Consumer Discretionary: The below chart attributes the performance of the SP500 stocks by sector (19-Feb to 14-Mar) into where macro has been offside (a drag pulling spot returns lower) or onside (a propeller pulling spot returns higher); similarly where idiosyncratic drivers (i.e. ex-macro) has been offside or onside. The % split by sector through this pullback is shown below.

The focus of the macro drag has been growth, captured by accelerating Fed rate cuts: At the heart of Qi’s Risk Model is the determination of stock factor exposures. No surprise that cyclicals would like higher metals, tighter HY credit spreads and lower risk aversion. However, aside from those risk barometers, they need confidence in the near-term outlook i.e. fewer rate cuts being priced. In contrast, more defensive sectors are happy with lower real rates, a weaker dollar and more Fed cuts. Below, we show the top 3 macro upside drivers by sector.

Technology, Industrials and Consumer Discretionary most sensitive to the drag from Fed rate cuts: The below chart shows the sensitivity by sector to this factor.

At the stock level, we screen the top 30 who want to see few Fed rate cuts: The top 30 is dominated by the above cited sectors – Tesla, Caesars Entertainment, Parker Hannifin etc. The full list is available on request.

So where to from here? If rate cut expectations can steady, cyclicals can steady BUT the model suggests to still fade the rallies: Qi’s Risk Forecast for the S&P500 is on the rise – specifically, we show below the deviation of that forecast from its 50d mean – currently +1.3 standard deviations. However, there is scope for this to move higher. If Fed rate cut expectations can steady, US cyclicals can steady. However, a more powerful rebound is likely only when our indicator below is more stretched. The tricky mix of top-down headwinds (policy uncertainty) and bottom-up headwinds (what PE for US Tech now?) will not go away easily. We would still be fading the rallies for now.

Disclaimer
This document is being sent only to investment professionals (as that term is defined in article 19(5) of the Financial Services and Markets Act 2000 (Financial Promotion) OrdeRSq005 (“FPO”)) or to persons to whom it would otherwise be lawful to distribute it. Accordingly, persons who do not have professional experience in matters relating to investments should not rely on this document. The information contained herein is for general guidance and information only and is subject to amendment or correction. This document is not directed to, or intended for distribution to or use by, any person or entity who is a citizen or resident of or located in any locality, state, country or other jurisdiction where such distribution, publication, availability or use would be contrary to law or regulation.
This document is provided for information purposes only, is intended for your use only, and does not constitute an invitation or offer to subscribe for or purchase any securities, any product or any service and neither this document nor anything contained herein shall form the basis of any contract or commitment whatsoever. This document does not constitute any recommendation regarding any securities, futures, derivatives or other investment products. The information contained herein is provided for informational and discussion purposes only and is not and, may not be relied on in any manner as accounting, legal, tax, investment, regulatory or other advice.
Information and opinions presented in this document have been obtained or derived from sources believed to be reliable, but Quant Insight Limited (Qi) makes no representation as to their accuracy or completeness or reliability and expressly disclaims any liability, including incidental or consequential damages arising from errors in this publication. No reliance may be placed for any purpose on the information and opinions contained in this document. No representation, warranty or undertaking, express or implied, is given as to the accuracy or completeness of the information or opinions contained in this document by any of Qi, its employees or affiliates and no liability is accepted by such persons for the accuracy or completeness of any such information or opinions. Any data provided in this document indicating past performance is not a reliable indicator of future returns/performance. Nothing contained herein shall be relied upon as a promise or representation whether as to past or future performance.
This presentation is strictly confidential and may not be reproduced or redistributed in whole or in part nor may its contents be disclosed to any other person under any circumstances without the express permission of Quant Insight Limited.