1. Regime change for EURUSD?
2. If the US sneezes, will Europe catch a cold?
3. US HY vs Itraxx XOver

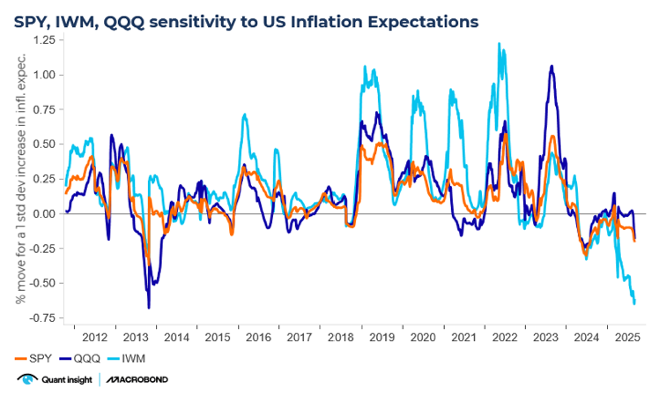
1. Small Cap rotation is hostageto inflation
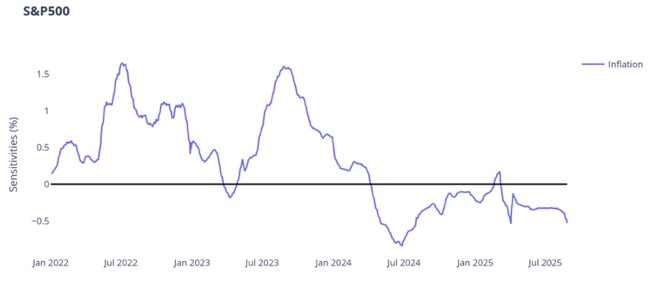
2. Rate Volatility - the BlindSpot in Equity Risk
3. Rising Rate Vol - the AchillesHeel of IBB
1. Regime change for EURUSD?
Over the last 5 years, EURUSD has tended to have a negative relationship with VIX.Qi's sensitivity analysis - the percentage move in spot FX for a 1 sigma shock up in US equity vol - shows that spikes in risk aversion have been consistent with lower EURUSD.
Makes sense: the US Dollar is the flight-to-quality play. Today, however, that pattern of association has turned positive: risk off equates to EURUSD upside.

The suggestion is the transition from MAGA to MEGA is not only encouraging capital flows from the US to Europe but is also starting to give the Euro a safe havenrole.
That would be a major structural change if it were to last. But there are signs the positive sensitivity is already abating. The evolution of this pattern could be a barometer for the whole US-Europe narrative at large.
2. If the US sneezes, will Europe catch a cold?
Arguably, European equities are now trading ex-two key catalysts.
One, it feels like the “German fiscal spending boom” is no longer new news. The German budget expansion passed the Bundestag but with limited reaction in stocks.
Two, Putin / Trump negotiations suggest we should not expect a quick conclusion to the Ukraine conflict.
The rush toreallocate from the US to Europe is reflected in the Stoxx 600 now having apositive exposure to VIX according to Qi’s models. In other words, it has become market belief that if the US sneezes, Europe won’t catch a cold.
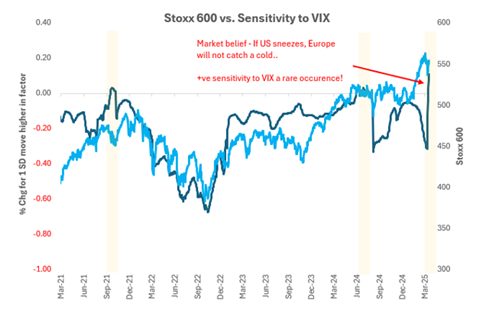
This is a rare occurrence. It has occurred only twice before in the last 4yrs. On both of those occasions (Sep-21 and Jul-24), we saw a pullback in the Stoxx 600. -5%and -7%, respectively.
Looking ahead, westill face the April 2 tariff deadline where Trump plans to implement“reciprocal tariffs”, raising the ante for Europe.
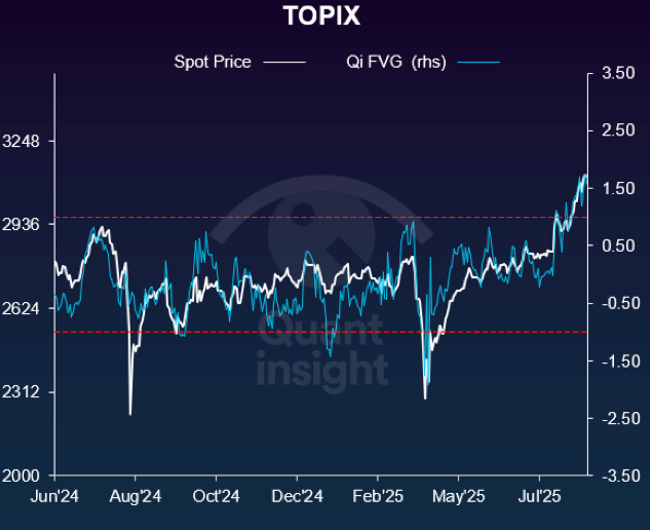
3. US High Yield vs. Itraxx Xover
Qi model value for the spread between CDX US HY spreads and Itraxx Xover spreads has beenwidening. Aggregate macro conditions are consistent with US high yield credit trading 23bp over their European peers.
In this US-European re-rating, however, the market has moved even further. The spot spread is nearly 20bp wider again. That's a Fair Value Gap of over 1 sigma.

The model is not in regime (36% confidence) so there's no official signal. That said, we'd be watching macro-warranted fair value very closely. If the blue line above doesn't set new wides, the implication is the US credit underperformance trend is losing momentum.
Disclaimer
This document is being sent only to investment professionals (as that term is defined in article 19(5) of the Financial Services and Markets Act 2000 (Financial Promotion) OrdeRSq005 (“FPO”)) or to persons to whom it would otherwise be lawful to distribute it. Accordingly, persons who do not have professional experience in matters relating to investments should not rely on this document. The information contained herein is for general guidance and information only and is subject to amendment or correction. This document is not directed to, or intended for distribution to or use by, any person or entity who is a citizen or resident of or located in any locality, state, country or other jurisdiction where such distribution, publication, availability or use would be contrary to law or regulation.
This document is provided for information purposes only, is intended for your use only, and does not constitute an invitation or offer to subscribe for or purchase any securities, any product or any service and neither this document nor anything contained herein shall form the basis of any contract or commitment whatsoever. This document does not constitute any recommendation regarding any securities, futures, derivatives or other investment products. The information contained herein is provided for informational and discussion purposes only and is not and, may not be relied on in any manner as accounting, legal, tax, investment, regulatory or other advice.
Information and opinions presented in this document have been obtained or derived from sources believed to be reliable, but Quant Insight Limited (Qi) makes no representation as to their accuracy or completeness or reliability and expressly disclaims any liability, including incidental or consequential damages arising from errors in this publication. No reliance may be placed for any purpose on the information and opinions contained in this document. No representation, warranty or undertaking, express or implied, is given as to the accuracy or completeness of the information or opinions contained in this document by any of Qi, its employees or affiliates and no liability is accepted by such persons for the accuracy or completeness of any such information or opinions. Any data provided in this document indicating past performance is not a reliable indicator of future returns/performance. Nothing contained herein shall be relied upon as a promise or representation whether as to past or future performance.
This presentation is strictly confidential and may not be reproduced or redistributed in whole or in part nor may its contents be disclosed to any other person under any circumstances without the express permission of Quant Insight Limited.

.png)