1. Climbing the wall of worry but SPY FVG narrowing into earnings season
2. Within commodity plays, XLB better bet than XLE
3. Beware US yield curve flattening

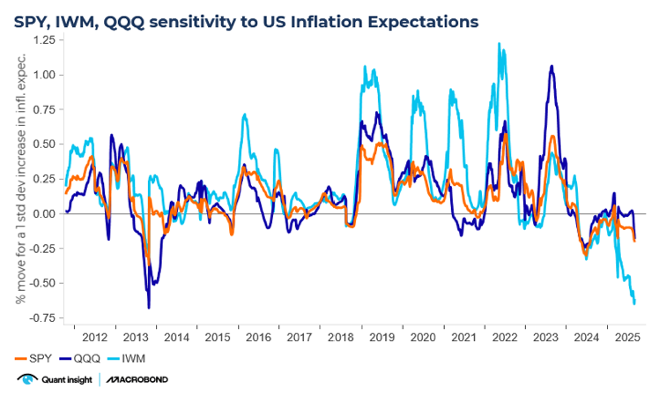
1. Small Cap rotation is hostageto inflation
2. Rate Volatility - the BlindSpot in Equity Risk
3. Rising Rate Vol - the AchillesHeel of IBB
1. Climbing the wall of worry but SPY FVG narrowing into earnings season
Last week, we said that AAII sentiment and the SPY Qi FVG had hit 1yr lows. So far, postthe inauguration, risky assets have given a vote of confidence and climbing that wall ofworry. Trump’s comments on tariffs are still being seen through the lens of a negotiationtool – more bark than bite. The start of earnings season has also been supportive, criticalgiven Qi’s short term model highlighting that FCIs are front and center. This has meant fairvalue gaps have narrowed – on both Qi’s short term and long term models we areapproaching model fair value.

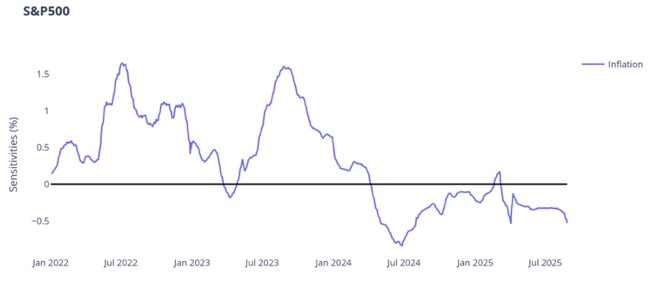
In December last year, Qi’s short term horizon model for SPY saw macro explanatorypower slump to almost zero! Since the turn of the year, it has shot back up to 79% RSqtoday. No surprise that the top drivers of SPY are real rates, HY corporate credit spreads,CB QT expectations (rate vol) and oil prices. Having been immune to tighter FCIs over thelast couple of months, the negative relationship is now resuming. In other words, withprofit multiples likely remain constrained by FCIs for now and FVGs closing, this earningsseason must shine. Next week is when we start entering the heart of the season.
2. Within commodity plays, XLB better bet than XLE
The best performing sector YTD is Energy. Trump repeated the slogan “Drill, baby, Drill”in his inauguration speech. The reality is that after record crude production under Bidenit may be harder to deliver on all the big talk with prices also under pressure from falteringglobal demand. The sector screen now as the richest relative to its sector peers at +0.8sigma.

However, where XLE looks most extended is relative to Materials. Above we show the Qifair value gap of the XLB vs. XLE pair (in blue) and the spot price in white. The FVG sits at1yr lows. If you believe the market is too bearish on US / China relations and tariffposturing is a prelude to a better deal, this would be bullish the pair.Our backtest of long signals when reaching -1 sigma FVG, reveals an 64.5% win rate witha positive average return.

3. Beware US yield curve flattening
Curve steepeners are a consensus trade amongst rate investors. There are strong arguments for that idea but tactically there is potential for the yield curve to flatten in thenear term.On Qi, macro-warranted fair value for the 5s30s US yield curve is -23bp. Fair value was -14bp at the start of 2025. The additional inversion has been driven by the surge in trackingGDP growth & increase in inflation expectations (inverted in yellow below).

On current patterns, higher-for-longer from the Fed should equate to a flatter yieldcurve. The market has lagged that re-pricing with 5s30s USD swaps curve currentlysitting around-11bp.

4. How to trade "Stargate"
President Trump's announcement of a joint venture between the US government andtech leaders like Softbank, OpenAI & Oracle is a potentially huge,game-changing event.But how are investors supposed to capture this trend?Thematic baskets from the sell-side offer you the stock picking skills from their sectoranalysts, plus the diversification of an ETF.One obvious example would be Goldman's Power Up America - a basket of stocksdesigned to "benefit from the growing demand for power driven by electrification, EVs,data centres & reshoring".

On Qi, there's no valuation edge currently. It was 1 sigma (10.5%) cheap to macroconditions at the end of last year, but has now caught back up. From here it's a case ofwatching macro momentum (i.e. Qi model value) which is trending firmly higher.GS's AI Beneficiaries vs at risk basket hit 1 sigma cheap as recently as last week. Thisweek's Trump bump has seen the Valuation Gaphalf but it still sits 0.5 sigma (2.7%) belowQi's macro-warranted model value.Moreover, that's still a significant level - this FVG has only been seen 5x when the modelis in regime & has produced an 80% hit rate. FVG correlation to spot price looks decentof late, i.e. we can trust the mean reversion properties of this signal.

Further afield could something like Goldman’s Japan Semiconductors basket benefitfrom such a theme? It sits 0.7 sigma (9.4%) cheap to the broad macro environment. Qimodel value has moved up this week but is yet to break above the 4month range. Watch macro momentum for clear signs of a new uptrend.
5. RoW > US equities?
Headline risk is going to be a constant threat under Trump 2.0. Today's Davos address,for example, could spark a "risk off" move if he sounds hawkish on trade. But, thus far, thelack of detail on tariffs has prompted a sigh of relief. That's most evident in FX withvolatility falling back from elevated levels.In equities its most obvious in the rally in European indices. The question facing assetallocators is , if they believe RoW stocks can enjoy a period of catch-up to the US, whichinternational markets offer the best risk-reward? This is where Qimodel value & Fair ValueGap can be invaluable. Some examples:The DAXsits 0.7 sigma (2.7%) rich to macro. But note the strength of macro momentum.Qi model value has risen 3.6% in the last two weeks alone. The market is moving further &fasterimplyingthis isn’t a great entry level. But there's no definitive bear signal here givenimproving macro conditions.

The Euro Stoxx 50 screens as 1.5 sigma (3.1%) rich to macro. Macro-warranted modelvalue has risen but not to the same degree as the DAX. A richer FVG plus more modestmacro momentum suggests pan-European indices look potentially more vulnerable toany trade shock.

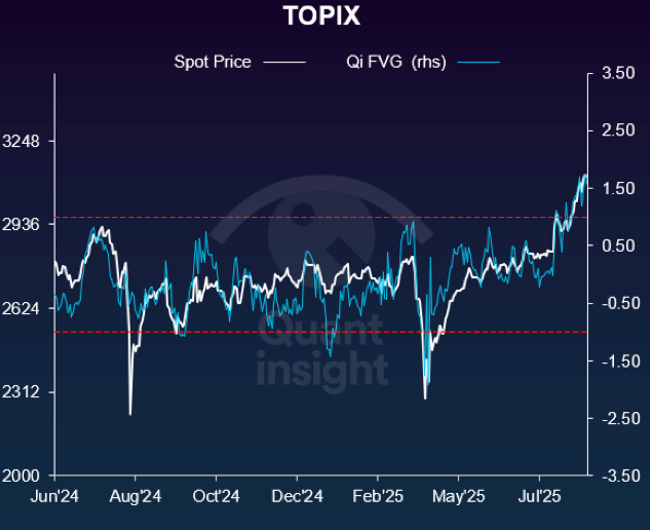
But perhaps the most interesting observation is that asset allocators should be lookingeast to Asia. The TOPIXfor example is lagging the early 2025 equity rally. It sits 1 sigma or3.1% below aggregate macro conditions which again are trending higher.


.png)