1. A message from bonds & commodities
2. European Banks - too far, too fast
3. Value the Comeback Kid but tariff risks temper the enthusiasm

1. Small Cap rotation is hostageto inflation
2. Rate Volatility - the BlindSpot in Equity Risk
3. Rising Rate Vol - the AchillesHeel of IBB
1. A message from bonds & commodities
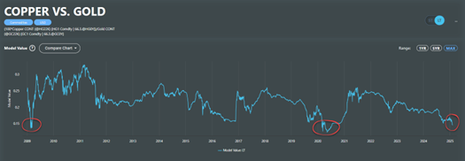
Much of 2025's early price action seems consistent with the idea we're sitting in themiddle of the Dollar smile - a point where economic growth is just decent enough toundermine US exceptionalism & favours the RoW.There are two warnings from the commodity & bond market that could disrupt the ideawe're in that middle sweet spot.Firstly, the red warning - Qi's model of the Copper / Gold ratio is falling to levels onlypreviously seen during Covid lockdowns & the GFC.The ratio of industrial versus precious metals is an old school gauge of the globaleconomic cycle - new lows suggest the commodity market is growing more fearful of aglobal trade war & hence recession.
Secondly, the amber warning. Since mid-December, UST yields have been too highrelative to prevailing macro conditions. Now 10y US Treasury yields are back at 4.45%,Qi's macro-warranted model value.

Qi's model is strong (84% confidence) & the market has now mean reverted to macrofundamentals. Going forward, watching Qi model value for clues on macro momentumis critical.It has fallen 12.5bp since mid-January: rising inflation expectations have been offset by amoderation in economic growth, a pause in the hawkish re-pricing of Fed rate cuts plusmore subdued rate volatility. Qi provides a real-time aggregation of these crosswinds.Bessent has flagged how important 10y UST yields are. That's especially true now since adeflationary signal from both the bond and commodity market together would threatena host of trades that have been the early 2025 performers.
2. European Banks - too far, too fast
Perhaps a surprising fact is that European banks have outperformed the Magnificent 7over the last 1yr. Sector performance has particularly accelerated since last November.

The macro drivers reflect the sector’s reflationary posture. It wants higher GDP growth, astronger Euro, higher metals, higher real yields and tighter credit spreads.However, through this year the valuation gap between spot price and Qi’s macrowarranted fair value has expanded to +1.1 sigma. The fair value gap is at its highs relativeto the last 1yr. See the chart below where we plot the sector’s fair value gap against itsspot price – the strong relationship is sending a warning Qi’s FVG for the sector is anexploitable mean-reversion opportunity.To empirically see this disconnect, below we simply plot SX7P vs. copper and real yields.

Idiosyncratic drivers may well have dominated – earnings have been solid and investorshave been looking for value in the face of concentrated US market. However, Trump hasmade clear that he will “absolutely” impose tariffs on the EU. Needless to say, anyworsening of credit owing to economic impacts from trade war escalation will have anoversized impact on banks.Thus far, European markets have been exceptionally resilient. There is hope for lack oftrade escalation but “hope” is a not a strategy. We are simply highlight that tariff risks arenot being fully priced in.
3. Value the Comeback Kid but tariff risks temper the enthusiasm
In line with the observation above on European banks, Value has been outperformingGrowth since late last year. This is a reflection of the challenge to the US Exceptionalismthesis. The outperformance we have seen has come alongside the weakness we haveseen in the Dollar YtD. See the chart below highlighting the strong inverse relationship oflate.Growth, and its close cousin Momentum, is the style more synonymous with the Trumpboom trade of higher economic growth, higher rates and stronger dollar. Indeed, itsoutperformance over Value has come alongside the US equities outperforming RoWWorld equities.
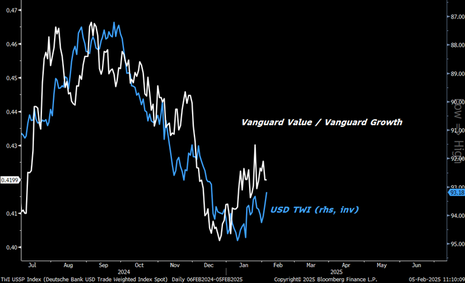
Now delaying implementation leaving scope for negotiations has seen the dollar movelower after the initial Executive Order was announced. However, we do recall that whentariffs eventually materialised in summer 2018, the news did lift the dollar. For now, the lingering tariff threat could limit Dollar downside.Below we should the relative performance of Vanguard Value vs. Vanguard Growthoverlaid with Qi’s fair value gap of the pair. The latter is close to the highs of it 1yr range.While, we share the view that US Exceptionalism is at risk (see last week’s note), it won’tbe so straightforward if trade wars escalate.

4. Similarly, DAX outperformance at risk
Perhaps another surprising fact, the DAX posted in Jan its best monthly performancesince November 2023! Economic growth is the largest broad macro driver of the index.See the chart below. Thus far, global growth expectations have been rising whether wesee the Citi global economic surprise index or the Eurozone and Japan composite PMIsmoving above 50. Alongside, there is an expectation that the results of the forthcomingGerman elections act as a catalyst to release the debt brake and pursue a moreexpansionary fiscal policy.

However, earnings expectations have been relatively stagnant over the last year incomparison to price performance i.e. we have seen significant PE expansion. See thechart below.Further, within Europe we know that the beta to global trade is highest in Germany. Thelikes of Autos and cyclical sectors would be the most vulnerable on higher tradeuncertainty.Qi shows that the DAX would benefit from a weaker EUR reflecting its global exposure.Our concern is that the flipside is the EUR can act a risk-on / risk-off barometer. As weshowed in last week’s note, a strong dollar has tended to mean under-performance ofnon-US markets historically.

What it striking to us is the Qi fair value gap for the S&P 500 relative to the DAX has hit 1yrlows. Therefore, tactically, this is not an area where we want to push the “USexceptionalism at risk” narrative. See the chart below.

5. USD downside
At the start of the week, USDCHF screened as 1 sigma (2.5%) rich to macro conditions. Ahistorically significant level with back-tests revealing it has a 76% hit rate as a bearishsignal.

That Fair Value Gap has subsequently narrowed but the cross still sits 1.6% above macrowarranted fair value.

Both the Dollar & Swiss Franc are considered flight-to-quality beneficiaries, but Qi’smodel (which has 75% explanatory power) suggests the Franc remains the ultimate safehaven. Current patterns show higher VIX is consistent with lower USDCHF.The upshot is twofold. Firstly, thenegative relationship with risk aversion means-at theselevels - it’s increasingly tough to justify USDCHF upside based exclusively on a "risk off"mood in markets.Secondly, at the broader macro level the risk-reward is skewed to USDCHF downside.That's regardless of whether VIX is above or below 20; and especially true with regard toBessent & 10y US yields given that interest rate differentials screen as the dominantdriver of the cross right now.


.png)