1. Trump Pivot coincides with Credit Impulse Extremes
2. S&P500– Past Peak Uncertainty but Path Still Choppy
3. MDAX Value from Recent Chaos

1. Trump Pivot coincides with Credit Impulse Extremes
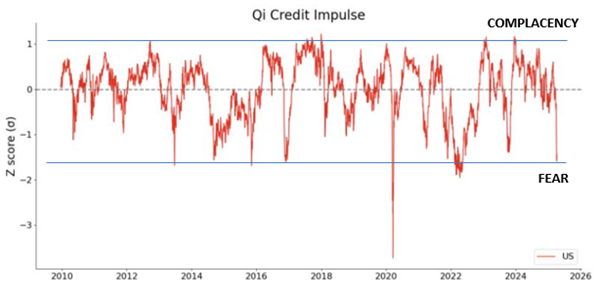
Qi’s macro models include several factors that speak to"financial conditions" - real yields, curve shape, credit spreads,bond volatility, FX, measures of funding & liquidity.
Looking at these factors in z-score terms we can see when credit is easy to come by (positive) & when credit is getting tight (negative).
This back-up in bond yields, spike in rate volatility & widening in credit spreads by Tuesday had produced a severe contraction in credit conditions.
In fact, post GFC, the fall in our credit impulse has only been worse during Covid lockdowns. We were on a par with episodes like the 2015 Yuan devaluation or the 2022 Fed hiking cycle.
With the announcement of a 90d delay for negotiations just as this indicator was hitting extremes andrisk premia rising rapidly in US Treasuries, it is telling the market that Trump is indeed reactive when conditions become extreme.
2. S&P500– Past peak uncertainty but path still choppy
Our ST model RSq for the S&P500 is high – 96%. Our model uses a multi-month lookback and therefore captures the current chaos well. It’s very clear what this market wants to see in term of macro: stronger dollar, flatter 5s30s,higher WTI, higher inflation expectations, higher GDP, higher 1y1y yields,lower vol, tighter credit. See the first chart.

The highest sector betas to these drivers – Financials, Technology, Consumer Discretionary, Industrials – no surprise there. See the second chart below showing sensitivity to the dollar as an example.

While the worst case is seemingly off the table and recession odds will drop, for theS&P 500 there is no depressed FVG signal yet (+0.5 sigma) nor in cyclicalsvs. defensives. Similarly, there was no capitulatory signal in fundamentalvaluations. CEOs will no doubt will take down their full year 2025 expectationsin the forthcoming earnings season to keep the hurdle low. Deals still have to made over the next 90 days. This is a delay not cancellation. Further, the uncertainty with respect to the US / China Trade War remains high. The growth /inflation trade-off will remain in focus.
3. MDAXValue from Recent Chaos
The risky asset sell-off has been indiscriminate given the broad investor deleveraging. Caught up in that sell-off was the German mid-cap stock index which also fell ~18% peak to trough - in-line with other more globally-exposed indices. The narrative of RoW vs. US will likely remain a feature of 2025 ifthe Dollar strength can not sustain. And within RoW, domestic value, benefitingfrom increased fiscal spend but less exposed to US tariffs, will likely outperform.
Bylast Friday, the MDAX index reached > 2 sigma below Qi model fair value -almost the largest valuation gap since 2009. As of last night, it was -1 sigma(5.4% below Qi model value).

.
Disclaimer
This document is being sent only to investment professionals (as that term is defined in article 19(5) of the Financial Services and Markets Act 2000 (Financial Promotion) OrdeRSq005 (“FPO”)) or to persons to whom it would otherwise be lawful to distribute it. Accordingly, persons who do not have professional experience in matters relating to investments should not rely on this document. The information contained herein is for general guidance and information only and is subject to amendment or correction. This document is not directed to, or intended for distribution to or use by, any person or entity who is a citizen or resident of or located in any locality, state, country or other jurisdiction where such distribution, publication, availability or use would be contrary to law or regulation.
This document is provided for information purposes only, is intended for your use only, and does not constitute an invitation or offer to subscribe for or purchase any securities, any product or any service and neither this document nor anything contained herein shall form the basis of any contract or commitment whatsoever. This document does not constitute any recommendation regarding any securities, futures, derivatives or other investment products. The information contained herein is provided for informational and discussion purposes only and is not and, may not be relied on in any manner as accounting, legal, tax, investment, regulatory or other advice.
Information and opinions presented in this document have been obtained or derived from sources believed to be reliable, but Quant Insight Limited (Qi) makes no representation as to their accuracy or completeness or reliability and expressly disclaims any liability, including incidental or consequential damages arising from errors in this publication. No reliance may be placed for any purpose on the information and opinions contained in this document. No representation, warranty or undertaking, express or implied, is given as to the accuracy or completeness of the information or opinions contained in this document by any of Qi, its employees or affiliates and no liability is accepted by such persons for the accuracy or completeness of any such information or opinions. Any data provided in this document indicating past performance is not a reliable indicator of future returns/performance. Nothing contained herein shall be relied upon as a promise or representation whether as to past or future performance.
This presentation is strictly confidential and may not be reproduced or redistributed in whole or in part nor may its contents be disclosed to any other person under any circumstances without the express permission of Quant Insight Limited.

