Is Your Equity Portfolio Aligned for a Turn in the Credit Cycle?
Using QI's Risk Model to Spotlight Potential Winners and Losers

Key Takeaways:
Macro Challenge: The growth-vs.-inflation tradeoff is weakening amid tighter lending standards and heightened policy uncertainty. Together, these pressures could drive up funding costs.
Why It Matters: Trends in high-yield credit spreads (CDX HY) often provide early signals on macro volatility and equity market inflection points.
Qi’s Lens: Our Risk Model stress-tests potential equity outcomes if CDX HY spreads widen by 50bps from here (back towards mid-2024 levels). On average, S&P 500 names fall ~5%—with two-thirds driven directly by wider spreads and one-third by knock-on macro effects. At the extremes, PLTR could drop by 16%, while CBOE might rise by 2.7%.
Context: The Evolving Credit Backdrop:
Growth-Inflation Tightrope: Recent macro data suggests that balancing growth and inflation is proving difficult. Lending standards remain in net tightening territory, limiting the room for cheaper corporate credit. Even if corporate fundamentals still look decent, further compression in spreads is becoming less likely.
Why CDX HY Spreads: High-yield credit spreads capture shifting economic expectations and risk appetite—much like equities. Historically, changes in these spreads have led equities at turning points, sometimes tightening before an equity bull run or widening in advance of equity drawdowns. In short, credit can provide valuable early clues about macro headwinds.
Increasingly Asymmetric Risks: While no one can predict the exact timing of a market turn, a precarious growth/inflation mix plus record policy uncertainty can stress corporate funding channels. Even modest widening in spreads may prompt more defensive positioning from investors, especially if volatility picks up.
Why it Matters?
Beyond the P&L: In more placid markets, fundamental equity drivers (e.g., earnings upgrades) can dominate. But during macro stress, corporate balance sheets and funding costs become increasingly pivotal.
Leading Indicators: In an early bull Market, credit spreads often tighten first (Dec-08 to Mar-09), followed by equities moving higher. In a late bull market, credit spreads can widen ahead of an equity peak. Think Jul-07 to Sep-07 when spreads widened and equities rolled over the next month.
Keeping an eye on credit signals—especially when the macro backdrop is in flux—can highlight hidden exposures you might not fully see in your standard equity analysis.

Qi’s Approach: Stress-Testing a 50bps Rise in CDX HY Spreads:
How We Model the Shock:
Scenario Definition: We examine a 50bps rise in CDX HY spreads from current levels. Historically, that would bring us back to the territory seen in July/August 2024, when spreads actually peaked around 381bps.
Integrated Factor Covariance: Credit rarely moves in isolation. A stress event that widens CDX HY spreads typically also drives up implied volatility (VIX) and shifts other macro factors. Our Factor CoVar matrix helps capture these correlations, ensuring the scenario is more than a simplistic one-factor exercise.
Cross-sectional Impact: We apply our Risk Model to each S&P 500 stock under this 50bps spread-widening shock. The output? A distribution of estimated returns that helps pinpoint which names and sectors are most vulnerable—and which might be more insulated or even gain.
Aggregate Universe Impact:
Broad Pressure: Most S&P 500 stocks decline in this scenario, averaging around a -5% move. Roughly two-thirds of that drop comes directly from wider spreads, while the rest reflects shifts in associated macro factors (like rising risk aversion).
Tail Outcomes: Some high-growth or more leveraged names—like PLTR—could see declines as steep as -16%. In contrast, certain stocks, such as CBOE, might edge +2.7% higher, benefiting from increased volatility or lower interest-rate sensitivity.

Sector Highlights:
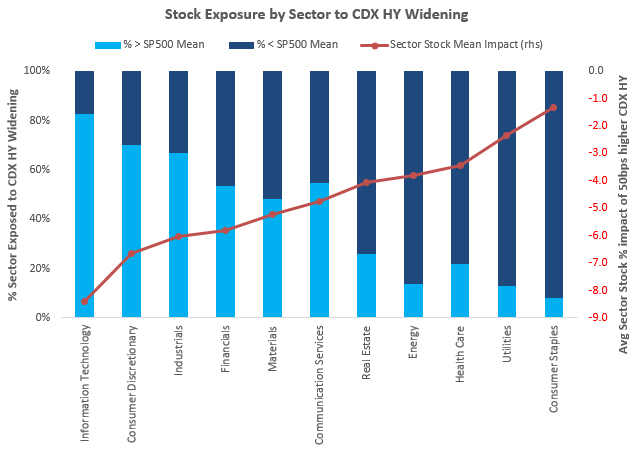
Most Exposed: Technology, Consumer Discretionary, Industrials, and Financials are more sensitive than the broad index average. Leverage, cyclicality, and higher beta can magnify the shock from rising credit stress.
More Resilient Sectors: Consumer Staples, Utilities, Health Care, and Energy look less impacted on average. Defensive cash flows or lower reliance on external funding can dampen drawdowns.
Distribution Within Sectors: Even within defensive sectors, some names vary widely. Conversely, certain tech or industrial stocks with strong balance sheets may fare better than sector peers.

Presented differently, more than half the stocks in Technology, Consumer Discretionary, Industrials and Financials sectors would fall greater than the S&P500 mean stock.
Stock-Level Perspective:
We show the top 5 / bottom 5 names most exposed by GICs sector. The full list is available on request. Such analysis can also be run on long / short portfolios on request so you can exactly where your positioning might be caught off-guard if credit spreads jump.

Next Steps:
Monitor Credit Spreads: In fast-changing macro environments, CDX HY is a bellwether worth watching. A quick move higher in spreads doesn’t guarantee an equity drawdown, but it can raise a flag to revisit funding cost assumptions.
Deep-Dive Scenario Analysis: If your portfolio skews toward certain factors or sectors, a more tailored scenario can show how each position reacts when credit inevitably swings.
Enhancing Your Existing Process: Qi’s Risk Model is designed to slot into your current workflow—no overhaul needed. You decide when and how to integrate these scenarios into your standard risk or alpha reviews.
Disclaimer
This document is being sent only to investment professionals (as that term is defined in article 19(5) of the Financial Services and Markets Act 2000 (Financial Promotion) OrdeRSq005 (“FPO”)) or to persons to whom it would otherwise be lawful to distribute it. Accordingly, persons who do not have professional experience in matters relating to investments should not rely on this document. The information contained herein is for general guidance and information only and is subject to amendment or correction. This document is not directed to, or intended for distribution to or use by, any person or entity who is a citizen or resident of or located in any locality, state, country or other jurisdiction where such distribution, publication, availability or use would be contrary to law or regulation.
This document is provided for information purposes only, is intended for your use only, and does not constitute an invitation or offer to subscribe for or purchase any securities, any product or any service and neither this document nor anything contained herein shall form the basis of any contract or commitment whatsoever. This document does not constitute any recommendation regarding any securities, futures, derivatives or other investment products. The information contained herein is provided for informational and discussion purposes only and is not and, may not be relied on in any manner as accounting, legal, tax, investment, regulatory or other advice.
Information and opinions presented in this document have been obtained or derived from sources believed to be reliable, but Quant Insight Limited (Qi) makes no representation as to their accuracy or completeness or reliability and expressly disclaims any liability, including incidental or consequential damages arising from errors in this publication. No reliance may be placed for any purpose on the information and opinions contained in this document. No representation, warranty or undertaking, express or implied, is given as to the accuracy or completeness of the information or opinions contained in this document by any of Qi, its employees or affiliates and no liability is accepted by such persons for the accuracy or completeness of any such information or opinions. Any data provided in this document indicating past performance is not a reliable indicator of future returns/performance. Nothing contained herein shall be relied upon as a promise or representation whether as to past or future performance.
This presentation is strictly confidential and may not be reproduced or redistributed in whole or in part nor may its contents be disclosed to any other person under any circumstances without the express permission of Quant Insight Limited.

